Subject: How to Copy from a SWMM 5 Table to Excel
Step 1. Highlight the rows you want to copy to Excel

Step 2: Use the Copy to Clipboard or Copy to File command

Step 3: Paste in Excel or open the exported text file

Subject: How to Copy from a SWMM 5 Table to Excel
Step 1. Highlight the rows you want to copy to Excel
Step 2: Use the Copy to Clipboard or Copy to File command
Step 3: Paste in Excel or open the exported text file
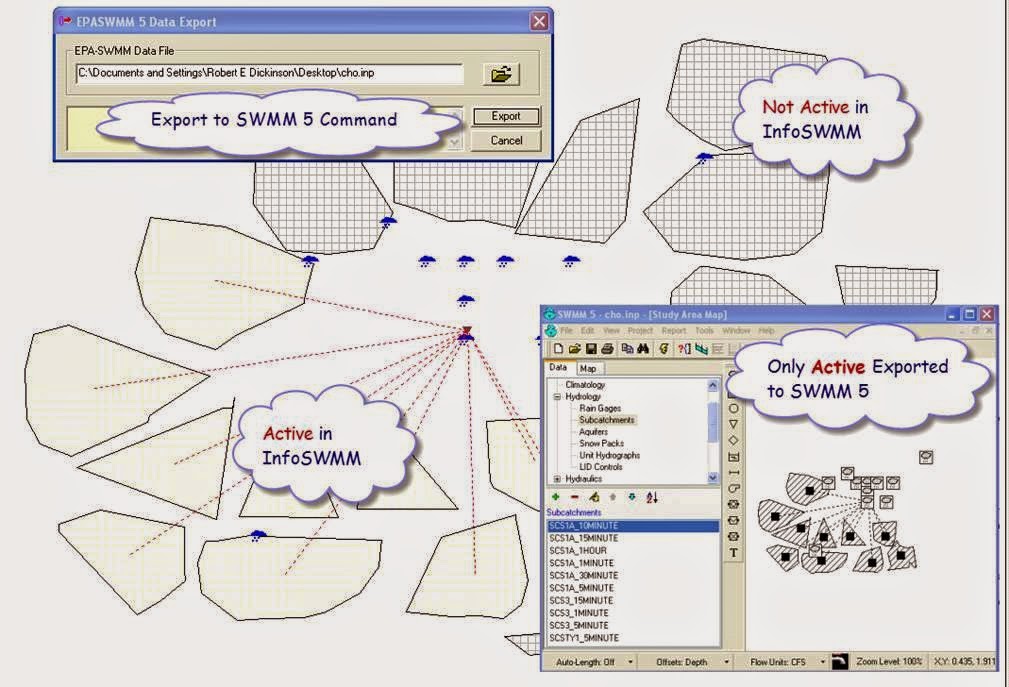
Subject: How to Make a Smaller Model out of a Large Model in InfoSWMM
InfoSWMM and H2OMAP SWMM will export only those ACTIVE elements to SWMM 5 as defined by the Facility Manager.
You can use the feature to make smaller SWMM 5 models and then reimport the exported smaller SWMM 5 model back into a H2OMAP SWMM or InfoSWMM scenario.
Note: Maximum Surcharge Height Over Crown Explanation
Here is an example of how the Maximum Surcharge Height over the Node Crown is calculated. Consider a manhole with an invert of 10 feet, one incoming pipe (Pipe A), one outgoing pipe (Pipe B), both pipes with a diameter of 2 feet, but the invert of Pipe A is 10 feet and the invert of Pipe B is 11 feet. What is the Maximum Surcharge height if the HGL at the node is 17 feet?
HGL at Node ---- 17 feet
Maximum Surcharge Height Over Crown is 4 feet
Node Crown --- 13 feet Pipe B Crown --- 13 feet
Pipe A Crown --- 12 feet
Pipe B Invert --- 11 feet
Pipe A Invert --- 1o feet MH Invert --- 10 feet
++++++++++++++++++++++++++++++++++++++++++++++++++++++++++++++++++++++++++


Subject: An Example of the Importance of the Term DQ4 in the SWMM 5 St Venant Solution
The four terms are are used in the new flow for a time step of Qnew:
Qnew = (Qold – dq2 + dq3 + dq4) / ( 1 + dq1)
when the force main or gravity main is full dq3 and dq4 are zero and Qnew = (Qold – dq2) / ( 1 + dq1)
The dq4 term in dynamic.c uses the area upstream (a1) and area downstream (a2), the midpoint velocity, the sigma factor (a function of the link Froude number), the link length and the time step or
dq4 = Time Step * Velocity * Velocity * (a2 – a1) / Link Length * Sigma
where Sigma is a function of the Froude Number and the Keep, Dampen and Ignore Inertial Term Options. Keep sets Sigma to 1 always and Dampen set Sigma based on the Froude number, Ignore sets Sigma to 0 all of the time during the simulation.
The value of dq4 increases when there is a significant difference in the cross sectional area of the downstream end of the link and the upstream end of the link. In this example, the downstream storage node causes a backflow in the link (Figure 1). The flow may look unstable in the link flow time series but the change in flow is simply due to the water sloshing back and forth. There is no continuity error as the term dq4 keeps the water in the link in balance (Figure 2).
 |
| Figure 1. GIF of Water Surface Showing the effect of the term dq4 |
 |
| Figure 2. Time Series of Flow - the Link has Mass Balance due to the term dq4 |
Subject: Use the SWMM 5 Scatter Graph to show the Pump Curve used during the Simulation
You can use a scatter graph to show the relationship between the pump during the simulation and the Storage Depth. If the pump is on the curve based on the pump summary table then the scatter graph should look like the pump curve. The pump summary table in the SWMM 5 RPT also shows you the time off the pump curve low and high.

Thanks to Plants, We Will Never Find a Planet Like Earth
Earth's flora is responsible for the glaciers and rivers that have created this planet's distinctive landscape
Perhaps even more surprisingly, vascular plants formed the kinds of rivers we see around us today, according to another article by Martin Gibling of Dalhousie University in Nova Scotia and Neil Davies of the University of Ghent in Belgium, who analyzed sediment deposition going back hundreds of millions of years. Before the era of plants, water ran over Earth's landmasses in broad sheets, with no defined courses. Only when enough vegetation grew to break down rock into minerals and mud, and then hold that mud in place, did river banks form and begin to channel the water. The channeling led to periodic flooding that deposited sediment over broad areas, building up rich soil. The soil allowed trees to take root. Their woody debris fell into the rivers, creating logjams that rapidly created new channels and caused even more flooding, setting up a feedback loop that eventually supported forests and fertile plains.
"Sedimentary rocks, before plants, contained almost no mud," explains Gibling, a professor of Earth science at Dalhousie. "But after plants developed, the mud content increased dramatically. Muddy landscapes expanded greatly. A new kind of eco-space was created that wasn't there before."
The idea of this blog of note is to show how one may extract information from the SWMM 5 or InfoSWMM RPT file and import the Excel File as a feature in InfoSWMM. This blog has an example Excel file to illustrate the linkage. The steps are:
Step 1: Copy the whole row from Conduit Summary from the InfoSWMM Browser
Step 2: Add the two columns length and slope from the Link Summary Table and the InfoSWMM Browser
Step 3: You need a few calculations based on the table values from SWMM 5 to estimate the CFL time steps in the .
Step 4: Add the Excel Spreadsheet as a layer in InfoSWMM – the Named Range should be added to insure valid numbers and not Nulls after the join
Step 5: You can now plot the CFL Time Step for the Links using the Layer Properties command in Arc Map
Step 1: Copy the whole row from Conduit Summary

Step 2: Add the two columns length and slope from the Link Summary Table

Step 3: You need a few calculations based on the table values from SWMM 5 to estimate the CFL time steps.
The CFL Step = Length / (Full Velocity + (Gravity * Full Depth)^0.5)
Full Velocity = Full Flow / Full Area
You also need to create a Name A Range for you data so that the data does not show up as Nulls

Step 4: Add the Excel Spreadsheet as a layer in InfoSWMM – the Named Range should be added

Step 4: Join the Excel Table to the InfoSWMM Conduit Feature Layer

Step 5: You can now plot the CFL Time Step for the Links using the Layer Properties command in Arc Map


SWMM 5 does not have a explicit timer in its Real Time Control (RTC) rules but you can approximate it by using a Control Curve as in the attached example model. The Control Curve will modify the setting of the Weir by the Inflow to the Storage node. You can have normal weir flow settings based on the invert elevation of the weir and the Surface node water surface elevation but in addition you can control the weir setting by:
1. Closing the weir when the inflow is low,
2. Closing the weir by staggered Storage node depth,
3. Opening the weir gradually when the inflow increases
4. Closing the weir by a combination of Node Depth IF statements and Control Curve rules
For example, you can have the Weir Setting controlled the Node Depth, Link Inflow and Node Inflow simultaneously approximately with the depth and the inflow parameters closing the weir by proxy instead of by time since the closing.

Innovyze, a leading global innovator of business analytics software and technologies for wet infrastructure, today announced the City of Hendersonville, North Carolina, has selected InfoSewer for ArcGIS (Esri, Redlands, CA) as its sewer modeling platform.InfoSewer has helped define the standard in the industry for GIS-centric sewer network analysis, planning and design since 2003.
The City of Hendersonville’s Water and Sewer Department is responsible for providing water service to more than 62,000 residents and businesses of Hendersonville and Henderson County and sewer service to more than 19,000 residents and businesses. The Department is also responsible for the operation and maintenance of over 580 miles of water mains, 57 water pumping stations, 24 water storage tanks (ranging in size from 100,000 gallons to 5 million gallons), over 185 miles of sewer mains and 37 sewer pumping stations. “InfoSewer gives us the blend of powerful, easy-to-use analysis capabilities we need to effectively plan and manage our sewer system,” said Brent Detwiler, City Engineer. “We have a significant investment in Esri ArcGIS technology, andInfoSewer lets us leverage our GIS data for fast and accurate modeling.”
Certified by the National Association of GIS-centric Software, InfoSewer is a powerful ArcGIS-based computer program for planning, designing, analyzing, and expanding sanitary, storm and combined sewer collection systems. It can be effectively used to model both dry-weather and wet-weather flows and determine the most cost-effective and reliable method of wastewater collection. Built atop ArcGIS, InfoSewer enables engineers and GIS professionals to work simultaneously on the same integrated platform, commanding powerful GIS analysis and hydraulic modeling in a single environment using a single dataset.
InfoSewer is used worldwide by municipal engineers and planners to create detailed, accurate models of their sewer infrastructure systems. These models enable them to evaluate the effect of new developments, zoning changes, and other additional loads on system flows; pinpoint current and future problem areas; predict overflows and backups; and determine how best to restore needed capacity lost to infiltration and inflow with the least rehabilitation.
Users also rely on these models to compute hydrogen sulfide generation and corrosion potential; analyze the rate of Biochemical Oxygen Demand (BOD) exertion; track sediment movement and deposition; trace pollutant contribution from source nodes; perform time of concentration calculations; calculate the amount of pollutant transported to the wastewater treatment plant; and assess pollutants’ impacts on receiving waters. Extensive scenario management functionality enables users to analyze existing or future sewage collection systems. The application also provides vital tools for meeting and exceeding environmental regulations and improving community relations via database queries and map displays.
InfoSewer also delivers advanced design functionality and exponential increases in efficiency while simplifying use. Users can quickly and reliably design new sewer collection systems that consider standard design criteria such as flow depth-to-pipe diameter ratios, velocity, slope, soil cover depth, and pipe crown drop. Using user-input manhole locations and rules, InfoSewer calculates the optimal pipe and slope, invert elevation of conduits and manholes, soil cover depths at both ends of each pipe section, and cost of excavation and reinstatement to meet target design criteria. Results can be reviewed using profile plots with advanced labeling of 30 node and link variables, color-coded sewer maps of these variables, or 20 comprehensive tabular reports. The profile plots can be automatically updated in the model database for steady state and extended period simulations of new and existing designs, greatly simplifying the model-building process.
Together, these capabilities help wastewater utilities worldwide dramatically raise productivity and efficiency by rapidly developing practical and optimal capital improvement strategies that minimize costs while improving system reliability, integrity and performance. By making engineering professionals more productive and their organizations more competitive, InfoSewer delivers benefits utilities can pass on to their customers through better designs and higher quality standards, achieved in a shorter turnaround time.
“InfoSewer continues to evolve to meet the growing needs of top utilities around the globe,” said Innovyze Americas Operations Director J. Erick Heath, P.E. “We are thrilled that progressive leading utilities like Hendersonville are using InfoSewer to design and manage the most efficient sewer collection systems possible.”
Category: Water
Posted on: January 18, 2012 4:14 PM, by Liz Borkowski
Philadelphia and Green Infrastructure
Aging US water infrastructure has meant more leaks, flooded basements, and massive sinkholes in cities across the US. Fixing the water and sewer systems in need of repair will take billions of dollars, and it's hard to find that kind of money in the budget these days.
Saqib Rahim reports for ClimateWire on Philadelphia's decision to use "green infrastructure" rather than building a larger pipe system to handle the water that's dumped on the city during severe storms. The combination of more intense storms and more paved area is a problem: Impervious surfaces like roads, sidewalks, and parking lots can't absorb rainfall, so it ends up in the city's stormwater collection system -- which, in many older cities, is combined with the sewage system. When these combined systems are overwhelmed by heavy rainfall, the result is often that a rainfall-and-sewage mixture gets discharged into a local waterway. (Read more about this problem here.) Rahim explains Philadelphia's solution to this problem:
Instead of building an even larger pipe system to address the issue, [Water Department Commissioner Howard] Neukrug pitched the most aggressive "green infrastructure" plan in the country. Through increased vegetation, rain barrels, sponge-like roads and other measures, the city would try to absorb more water where it fell. The ground would filter out pollutants, reduce strain on the pipelines and make the city a more attractive place.
Neukrug tells Rahim that the green infrastructure solution will cost Philadelphia $2 billion, compared to $8 billion to $10 billion for larger underground tunnels. But the part of the city's plan that's currently causing a controversy is what water customers will pay. They'll now be charged not just for the water they use, but for their contributions to stormwater problems -- that is, sites with a lot of impervious surfaces will pay more.
The average household will see an average bill rise from approximately $60 to around $63.50, Rahim reports. For some large businesses, though, costs could rise significantly over the next few years -- and 100 of these businesses have hired a lobbyist and met with the Water Department to oppose implementation of the new billing practices.
I can understand why these businesses are upset. When they invest and plan for their businesses' futures, they assume the rules will stay the same. Their extensive impervious surfaces are causing problems for public health, but they might not have realized that their decisions about what to pave were raising costs for the city's residents (and everyone else affected when its sewage ended up in local waterways).
Changing the rules isn't ideal, but it's the best solution if the current rules create incentives for behavior that harms public health. If this country had never changed the rules to make businesses start bearing more of the cost for problems they cause the general public (externalities, in economic language), we'd still have rivers so polluted that they catch fire. Governments can ease the pain by providing grants or low-interest loans to help businesses and individuals invest in greener setups -- and, Rahim reports, Philadelphia is offering loans to businesses that want to green their facilities. Increases in bills will also be capped at 10% or $100 per month.
Such an approach could also be used to address other public health issues like CO2 emissions -- but so far, opposition to a carbon tax has been stronger than support. In the meantime, I'll be watching Philadelphia's effort and hoping it succeeds with a green solution to water infrastructure challenges.
Source: http://scienceblogs.com/thepumphandle/2012/01/changing_the_rules_in_the_midd.php#more
Note: Example SWMM 5 Model for Activated Sludge
Here is one example of how to model an activated sludge tank. The image is Wikipedia (http://en.wikipedia.org/wiki/Activated_sludge) and is the watermark background in the SWMM 5 GUI. There is 100 lps inflow, 20 percent recycle and 10 percent sludge drawoff. You can adjust the amount of recycle and sludge altering the pump type 2 flows or if you want to increase the inflows – add more flow in the RawWater inflow node.


Subject: Output Statstics Manager to find negative flows in InfoSWMM
Output Statstics Manager to find negative flows with these parameters:
1. Pipe Features
2. Use a Domain with your force mains
3. Select Flow
4. Event Dependent
5. Total – NOT Mean or Peak to find the negative and positive flows
6. Large NEGATIVE Flow Threshold
7. Large NEGATIVE Volume Threshold
8. Zero for Interevent Time to pick up all values
9. You will get a table that shows you the minimun flows, and a histogram of the flows


You can have flow dividers in SWMM 5 dynamic routing by using Storage Nodes for the dividers, OUTLET links for the downstream links and minimizing downstream HGL effects. The needed components are:
1. A Storage Node for the divider node as a OUTLET Link does not have a Surface Area,
2. Two or More OUTLET Links as the downstream diversion and cutoff links,
3. Two or More Rating Curves to divide the flow up based on either depth or head,
4. Pumps, Outfalls or Steep Sloped Links Downstream of the diversion and cutoff links to minimize downstream HGL effects

|
Major Bulgarian Utility Chooses InfoNet For Effective Network Management ViK Lovetch Utility Looks to Innovyze Solution to Manage Its Extensive, Complex Water Network |
|||||
|
Broomfield, Colorado USA, January 24, 2012 — Innovyze, a leading global innovator of business analytics software and technologies for wet infrastructure, today announced that ViK Lovetch, the water utility serving the Bulgarian city of Lovetch, has opted to utilize the powerful analysis and business intelligence capabilities ofInfoNet as its network management system. The purchase will represent a significant step up for the utility’s capabilities in this area. ViK Lovetch, established in 1959, also provides water and sewerage services for 100 towns and villages within the north-central Bulgarian administrative region — a total of 100,000 people, including 44,000 within the city of Lovetch. The utility operates a complex and challenging 1,114 mi (1,792 km) water supply network across its widely varied region. Just 65 mi (104km) of the network lies within the city. It also handles over 100 major pumping stations and chlorination facilities and more than 260 water sources and tanks. Two years ago, the utility’s new management team — Executive Director Ilian Iliev, and Deputy Executive Director Danail Sabevski — decided to leverage the power of contemporary technologies to manage the system’s substantial water and sewer system dataflows, which had been documented with paper plans, registers and CAD drawings. Their aim was to introduce a GIS-based system that would ultimately mesh with the utility’s existing CRM and accounting systems. Specialist consultancy and Innovyze channel partner Aquamod was chosen to undertake the pilot project. Aquamod Managing Director Alexander Litchev explains: “Several options were considered but InfoNet was the perfect choice due to its powerful functionality directly out of the box, user friendliness and fast learning curve. The utility managers were especially impressed by InfoNet’s professionally-designed data model, unlimited possibilities for future interconnections with our existing MS SQL server databases for CRM and accounting, and perfect price-quality mix.” The pilot project has three key targets: to introduce InfoNet; to convert existing network records for the Lovetch water supply system to the InfoNet database; and to provide training for the utility’s technical staff. Early this year, the company is aiming to integrate InfoNet within the SQL environment, enabling a direct link between the utility’s network, operations, finance and other databases. “We are delighted that InfoNet has been chosen as the network management tool for this important Eastern European region,” says Andrew Brown, Director of International Operations for Innovyze. “We’re impressed by ViK’s commitment to leveraging innovative technologies to boost its service offering, and proud to support it.” |
Note: The Keep and Dampen options and their effect on the four main terms of the St Venant equation.
The four terms are are used in the new flow for a time step of Qnew:
Qnew = (Qold – dq2 + dq3 + dq4) / ( 1 + dq1)
when the force main or gravity main is full dq3 and dq4 are zero and Qnew = (Qold – dq2) / ( 1 + dq1)
The dq4 term in dynamic.c uses the area upstream (a1) and area downstream (a2), the midpoint velocity, the sigma factor (a function of the link Froude number), the link length and the time step or
dq4 = Time Step * Velocity * Velocity * (a2 – a1) / Link Length * Sigma
where Sigma is a function of the Froude Number and the Keep, Dampen and Ignore Inertial Term Options. Keep sets Sigma to 1 always and Dampen set Sigma based on the Froude number, Ignore sets Sigma to 0 all of the time during the simulation
the dq3 term in dynamic.c uses the current midpoint area (a function of the midpoint depth), the sigma factor and the midpoint velocity.
dq3 = 2 * Velocity * ( Amid(current iteration) – Amid (last time step) * Sigma
dq1 = Time Step * RoughFactor / Rwtd^1.333 * |Velocity|
The weighted area (Awtd) is used in the dq2 term of the St. Venant equation:
dq2 = Time Step * Awtd * (Head Downstream – Head Upstream) / Link Length or
dq2 = Time Step * Awtd * (Head Downstream – Head Upstream) / Link Length
ormally, dq1 (Friction Loss / Maroon in the Graph) balances dq2 (Water Surface Slope Term or Green in the Graph) but often for links with a large difference between upstream and downstream depths dq4 (Red in the Graph) can have a significant value. If dq4 or dq3 are important then the depth of water to increases to pass the same flow using the Keep option over the Ignore. If you have a link with a Froude number near or over 1.0 (Supercritical) then using Keep or Dampen for the Options may result in depth differences. The effect of Keep is to increase the “loss” terms in the St Venant Equation. The effect of Dampen and Ignore is to decrease the sum of the “loss” terms in the St. Venant Solution and lower the simulated depth.

Note: The Keep and Dampen options and their effect on the four main terms of the St Venant equation.
The four terms are are used in the new flow for a time step of Qnew:
Qnew = (Qold – dq2 + dq3 + dq4) / ( 1 + dq1)
when the force main or gravity main is full dq3 and dq4 are zero and Qnew = (Qold – dq2) / ( 1 + dq1)
The dq4 term in dynamic.c uses the area upstream (a1) and area downstream (a2), the midpoint velocity, the sigma factor (a function of the link Froude number), the link length and the time step or
dq4 = Time Step * Velocity * Velocity * (a2 – a1) / Link Length * Sigma
where Sigma is a function of the Froude Number and the Keep, Dampen and Ignore Inertial Term Options. Keep sets Sigma to 1 always and Dampen set Sigma based on the Froude number, Ignore sets Sigma to 0 all of the time during the simulation
the dq3 term in dynamic.c uses the current midpoint area (a function of the midpoint depth), the sigma factor and the midpoint velocity.
dq3 = 2 * Velocity * ( Amid(current iteration) – Amid (last time step) * Sigma
dq1 = Time Step * RoughFactor / Rwtd^1.333 * |Velocity|
The weighted area (Awtd) is used in the dq2 term of the St. Venant equation:
dq2 = Time Step * Awtd * (Head Downstream – Head Upstream) / Link Length or
dq2 = Time Step * Awtd * (Head Downstream – Head Upstream) / Link Length
Normally, dq1 (Friction Loss / Maroon in the Graph) balances dq2 (Water Surface Slope Term or Green in the Graph) but often for links with a large difference between upstream and downstream depths dq4 (Red in the Graph) can have a significant value. If dq4 or dq3 are important then the depth of water to increases to pass the same flow using the Keep option over the Ignore. If you have a link with a Froude number near or over 1.0 (Supercritical) then using Keep or Dampen for the Options may result in depth differences. The effect of Keep is to increase the “loss” terms in the St Venant Equation. The effect of Dampen and Ignore is to decrease the sum of the “loss” terms in the St. Venant Solution and lower the simulated depth.

A surcharged node in SWMM 5 uses this point iteration equation (Figure 1):
dY/dt = dQ / The sum of the Connecting Link values of dQ/dH
where Y is the depth in the node, dt is the time step, H is the head across the link (downstream – upstream), dQ is the net inflow into the node and dQ/dH is the derivative with respect to H of the link St Venant equation. If you are trying to calibrate the surcharged node depth, the main calibration variables are the time step and the link roughness:
1. Mannings’s N
2. Hazen-Williams or
3. Darcy-Weisbach
The link roughness is part of the term dq1 in the St Venant solution and the other loss terms are included in the term dq5. You can adjust the roughness of the surcharged link to affect the node surcharge depth.
Figure 1. The Node Surcharge Equation is a function of the net inflow and the sum of the term dQ/dH in all connecting links. Generally, as you increase the roughness the value of dQ/dH increases and the denominator of the term dY/dt = dQ/dQdH increases.

Figure 2. The value of dQ/dH in a link as the roughness of the link increases.

Subject: How to Make Icons and Expand the Toolbars in InfoSWMM and InfoSewer
You can customize the toolbars in InfoSWMM and InfoSewer by clicking on Customize and performing 4 steps:
Step 1. Click on Customize
Step 2. Move the tool from the Command list to the toolbar.
Step 3. Change the Button Image for the Default Style.
Step 4. The Toolbar now has a new Icon for the InfoSWMM command.
Step 1. Click on Customize

Step 2. Move the tool from the Command list to the toolbar.

Step 3. Change the Button Image for the Default Style.

Step 4. The Toolbar now has a new Icon for the InfoSWMM command.

If you cannot open ArcMap, InfoSewer or InfoSWMM at all and get a fatal Esri error the problem may be the file normal.mxt
“If the startup file in ArcGIS Desktop or component applications (e.g., ArcMap, ArcGlobe, ArcScene) is corrupt, a fatal error can occur. Renaming or deleting the existing startup file will often resolve the error. Once the corrupted startup file is removed, ArcGIS will create a new startup file after the application is launched (http://kb.iu.edu/data/asuv.html).”
To remove the startup file in Windows XP for Arc GIS 10 go to the directory C:\Documents and Settings\Your Name\Application Data\ESRI\Desktop10.0\ArcMap\Templates and delete the file Normal.mxt. You then reopen Arc Map and the normal.mxt file will be recreated and smaller. You will have to reset the ArcMap toolbars to better control InfoSewer and InfoSWMM.
