All Posts (29)

Sort by

How to Understand your Hydraulics Output using InfoSWMM and InfoSWMM SA 2D and 3D Linked Graphics

InfoSWMM v 14.6 and InfoSWMM SA v2 (InfoSWMM SA is a not an Esri Extension in ArcMap) has many new graphical and map display tools that help answer the following modeling questions in a easy to understand group of linked Time Track Graph, 2D Graphs and 2D Thumbnails:

  1. How do the flows, depths, velocities, Froude Number, d/D, surcharged d/D change over time?
  2. Let’s you see a thumbnail of surcharged d/D in my Output Report Manager graphs,
  3. You can see the maximum, minimum and current surcharged d/D at any time in the Atrribute Browser (AB),
  4. Using the Time Track you can link the thumbnail, graphs, 2D view of the links in the AB and the Map Display on the Map of ArcMap or Arc Engine in InfoSWMM SA
  5. See Figure 1 for an example of how the Time Track connects all graphs and views.

Images of how each of the 24 shapes in InfoSWMM and InfoSWMM SA are shown in the linked 2D, Graph and Attribute Browser
Read more…
Here is a graphical view of the nonlinear runoff processes in InfoSWMM and SWMM5:
============================================================
1. Three runoff surfaces
a. Impervious with Depression Storage
b. Pervious
c. Impervious without Depression Storage
2. Evaporation
a. Constant
b. Time Series
c. Monthly
d. Temperature
e. Climate File
f. Monthly Adjustments for Climate Change
3. Slope (same for all runoff surfaces)
4. Infiltration
a. Horton
b. Modified Horton
c. Green Ampt
d. Modified Green Ampt
e. Curve Number or SCS or CN
f. Monthly Adjustments for Climate Change for all Infiltration Methods
5. Roughness (Manning’s n)
a. Impervious
b. Pervious
6. Width or the Dimension of the Subcatchment (same for all runoff surfaces)
7. Wind Speed for Snowmelt
a. Climate File
b. Time Series
8. Depression Storage
a. Impervious
b. Pervious
9. Temperature for Snowmelt
a. Climate File
b. Time Series
c. Monthly Adjustments for Climate Change
10. Other conne
Read more…

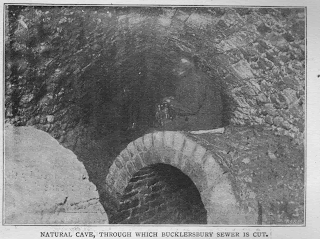
Underground London Sewers in 1898

sewer14.gif?width=666

    I am afraid, judging by the gingerly manner in which we went down the shaft, that we should not have been much good had any great difficulties been encountered. It was a primitive sort of ladder we had to go down, merely consisting of iron rings driven into the wall at intervals, and in our cumbrous and unaccustomed attire it was not a very comfortable job. However, we got down without any casualties, and, arrived at the bottom, found one of the sewermen waiting for us. He provided us each with a wooden sconce holding a candle, and thus provided we went along a short, sloping passage, at the end of which stood another guide, who assisted us to step down into the sewer itself. 

Read more…

Innovyze Offers Free Award-Winning GIS-Centric Water Modeling Software to Universities Worldwide

Free Student Edition of Industry Leading InfoWater and InfoSWMM Aimed at Giving Students Hands-On Experience, Better Preparing Industry-Ready Workforce and Shaping the Future

Broomfield, Colorado, USA, August 4, 2015

Fulfilling its promise of continually raising the bar in water resources engineering education and expanding the world of learning, Innovyze, a leading global innovator of business analytics software and technologies for smart wet infrastructure, today announced the availability of its industry-leading GIS-centric water and wastewater modeling software free to students and professors at higher education institutions worldwide. This special student edition of both InfoWater and InfoSWMM, limited to sixty links, is designed to provide universities worldwide with a simple, flexible way to use advanced, high performance water modeling software in their classrooms and labs. It will

Read more…

Detention Basin Basics in SWMM 5

detetention_pond.inp

Subject:  Detention Basin Basics in SWMM 5

 What are the basic elements of a detention pond in SWMM 5?  They are common in our backyards and cities and just require a few basic elements to model.  Here is a model in SWMM 5.0.022 that even has a fountain in the real pond – which we not model for now.   The components of the model are:

 1.   An inlet to the pond with a simple time series – a subcatchment can be added to it in a more complicated model but for now we will just have a triangular time series,

2.   A pipe to simulate the flow into the pond from the inlet,

3.   A Storage Node to simulate the Pond that consists of a tabular area curve to estimate the depth and area relationship,

4.   A Storage Node to simulate the Outlet Box of the Pond

5.   Two Small Rectangular Orifices to simulate the low flow outflow from the pond at an elevation less than the weir

6.   A large rectangular orifice to simulate the normal inflow to the Box

7.   A rectangular weir to

Read more…