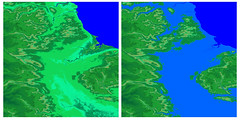
All Posts (522)

Sort by
From this empty map. The information about ext...

Image via Wikipedia

Outlook: Extreme
As the planet warms, look for more floods where it’s already wet and deeper drought where water is scarce.
By Elizabth Kolbert

The world's first empire, known as Akkad, was founded some 4,300 years ago, between the Tigris and the Euphrates Rivers. The empire was ruled from a city—also known as Akkad—that is believed to have lain just south of modern-day Baghdad, and its influence extended north into what is now Syria, west into Anatolia, and east into Iran. The Akkadians were well organized and well armed and, as a result, also wealthy: Texts from the time testify to the riches, from rare woods to precious metals, that poured into the capital from faraway lands.

Then, about a century after it was founded, the Akkad empire suddenly collapsed. During one three-year period four men in succession briefly claimed to be emperor. "Who was king? Who was not king?" a register known as the Sumerian King List asks.

For many years, scholars blamed the empire's fall on politics. But about a decade ago, climate scientists examining records from lake bottoms and the ocean floor discovered that right around the time that the empire disintegrated, rainfall in the region dropped dramatically. It is now believed that Akkad's collapse was caused by a devastating drought. Other civilizations whose demise has recently been linked to shifts in rainfall include the Old Kingdom of Egypt, which fell right around the same time as Akkad; the Tiwanacu civilization, which thrived near Lake Titicaca, in the Andes, for more than a millennium before its fields were abandoned around A.D. 1100; and the Classic Maya civilization, which collapsed at the height of its development, around A.D. 800.

The rainfall changes that devastated these early civilizations long predate industrialization; they were triggered by naturally occurring climate shifts whose causes remain uncertain. By contrast, climate change brought about by increasing greenhouse gas concentrations is our own doing. It, too, will influence precipitation patterns, in ways that, though not always easy to predict, could prove equally damaging.

Warm air holds more water vapor—itself a greenhouse gas—so a hotter world is a world where the atmosphere contains more moisture. (For every degree Celsius that air temperatures increase, a given amount of air near the surface holds roughly 7 percent more water vapor.) This will not necessarily translate into more rain—in fact, most scientists believe that total precipitation will increase only modestly—but it is likely to translate into changes in where the rain falls. It will amplify the basic dynamics that govern rainfall: In certain parts of the world, moist air tends to rise, and in others, the moisture tends to drop out as rain and snow.

"The basic argument would be that the transfers of water are going to get bigger," explains Isaac Held, a scientist at the National Oceanic and Atmospheric Administration's Geophysical Fluid Dynamics Laboratory at Princeton University. Climate models generally agree that over the coming century, the polar and subpolar regions will receive more precipitation, and the subtropics—the area between the tropical and temperate zones—will receive less. On a regional scale, the models disagree about some trends. But there is a consensus that the Mediterranean Basin will become more arid. So, too, will Mexico, the southwestern United States, South Africa, and southern Australia. Canada and northern Europe, for their part, will grow damper.

A good general rule of thumb, Held says, is that "wet areas are going to get wetter, and dry areas drier." Since higher temperatures lead to increased evaporation, even areas that continue to receive the same amount of overall precipitation will become more prone to drought. This poses a particular risk for regions that already subsist on minimal rainfall or that depend on rain-fed agriculture.

"If you look at Africa, only about 6 percent of its cropland is irrigated," notes Sandra Postel, an expert on freshwater resources and director of the Global Water Policy Project. "So it's a very vulnerable region."

Meanwhile, when rain does come, it will likely arrive in more intense bursts, increasing the risk of flooding—even in areas that are drying out. A recent report by the United Nations' Intergovernmental Panel on Climate Change (IPCC) notes that "heavy precipitation events are projected to become more frequent" and that an increase in such events is probably already contributing to disaster. In the single dec­ade between 1996 and 2005 there were twice as many inland flood catastrophes as in the three decades between 1950 and 1980.

"It happens not just spatially, but also in time," says Brian Soden, a professor of marine and atmospheric science at the University of Miami. "And so the dry periods become drier, and the wet periods become wetter."

Quantifying the effects of global warming on rainfall patterns is challenging. Rain is what scientists call a "noisy" phenomenon, meaning that there is a great deal of natural variability from year to year. Experts say that it may not be until the middle of this century that some long-term changes in precipitation emerge from the background clatter of year-to-year fluctuations. But others are already discernible. Between 1925 and 1999, the area between 40 and 70 degrees north latitude grew rainier, while the area between zero and 30 degrees north grew drier. In keeping with this broad trend, northern Europe seems to be growing wetter, while the southern part of the continent grows more arid. The Spanish Environment Ministry has estimated that, owing to the combined effects of climate change and poor land-use practices, fully a third of the country is at risk of desertification. Meanwhile, the island of Cyprus has become so parched that in the summer of 2008, with its reservoir levels at just 7 percent, it was forced to start shipping in water from Greece.

"I worry," says Cyprus's environment commissioner, Charalambos Theopemptou. "The IPCC is talking about a 20 or 30 percent reduction of rainfall in this area, which means that the problem is here to stay. And this combined with higher temperatures—I think it is going to make life very hard in the whole of the Mediterranean."

Other problems could follow from changes not so much in the amount of precipitation as in the type. It is estimated that more than a billion people—about a sixth of the world's population—live in regions whose water supply depends, at least in part, on runoff from glaciers or seasonal snowmelt. As the world warms, more precipitation will fall as rain and less as snow, so this storage system may break down. The Peruvian city of Cusco, for instance, relies in part on runoff from the glaciers of the Quelccaya ice cap to provide water in summer. In recent years, as the glaciers have receded owing to rising temperatures, Cusco has periodically had to resort to water rationing.

Several recent reports, including a National Intelligence Assessment prepared for American policymakers in 2008, predict that over the next few decades, climate change will emerge as a significant source of political instability. (It was no coincidence, perhaps, that the drought-parched Akkad empire was governed in the end by a flurry of teetering monarchies.) Water shortages in particular are likely to create or exacerbate international tensions. "In some areas of the Middle East, tensions over water already exist," notes a study prepared by a panel of retired U.S. military officials. Rising temperatures may already be swelling the ranks of international refugees—"Climate change is today one of the main drivers of forced displacement," the United Nations High Commissioner for Refugees, António Guterres, has said—and contributing to armed clashes. Some experts see a connection between the fighting in Darfur, which has claimed an estimated 300,000 lives, and changes in rainfall in the region, bringing nomadic herders into conflict with farmers.

Will the rainfall changes of the future affect societies as severely as some of the changes of the past? The American Southwest, to look at one example, has historically been prone to droughts severe enough to wipe out—or at least disperse—local populations. (It is believed that one such megadrought at the end of the 13th century contributed to the demise of the Anasazi civilization, centered in what currently is the Four Corners.) Nowadays, of course, water-management techniques are a good deal more sophisticated than they once were, and the Southwest is supported by what Richard Seager, an expert on the climatic history of the region, calls "plumbing on a continental scale." Just how vulnerable is it to the aridity likely to result from global warming?

"We do not know, because we have not been at this point before," Seager observes. "But as man changes the climate, we may be about to find out." 

Reblog this post [with Zemanta]
Read more…

Boundary Conditions in SWMM 4

Boundary Conditions in SWMM 4

For the sake of completeness and posterity I am including in this email an example SWMM 4.x Extran model that has all 7 possible boundary conditions for the outfalls. As Khalid mentions the value of NBCF on the I1 line determines which set of J lines is used for the outfall listed in the first column of line I1. The set of J1 lines is independent of the order of outfalls on the I1 lines. For example, I could have had the outfall using boundaries conditions 7 down to 1 instead of 1 to 7 - as long as the J lines are in the correct order.


EXAM43.DAT
Reblog this post [with Zemanta]
Read more…
Global average radiative forcing estimates and...

Image via Wikipedia

Lower Increases In Global Temperatures Could Lead To Greater Impacts Than Previously Thought, Study Finds

ScienceDaily (Mar. 1, 2009) — A new study by scientists updating some of the findings of the Intergovernmental Panel on Climate Change (IPCC) 2001 Third Assessment Report finds that even a lower level of increase in average global temperatures due to greenhouse gas emissions could cause significant problems in five key areas of global concern.


The study, published in theProceedings of the National Academy of Sciences, is titled "Assessing Dangerous Climate Change Through an Update of the IPCC 'Reasons for Concern."

In 2001, the IPCC published as part of its Third Assessment Report an illustrative figure which identified changes in climate authors determined to be "reasons for concern," and which could cause some or significant risks among five types of outcomes that could be categorized as "dangerous."

Sometimes referred to as the "burning embers" diagram, the five reasons for concern are:

  • Risk to unique and threatened systems, such as the potential for increased damage to or irreversible loss of unique and threatened systems such as coral reefs, tropical glaciers, endangered species, unique ecosystems, biodiversity hotspots, small island states, and indigenous communities. The study authors contend that there is new and stronger evidence since 2001 of observed impacts of climate change on unique and vulnerable systems, with increasing levels of adverse impacts as temperatures increase further.
  • Risk of extreme weather events, which tracks increases in extreme events with substantial consequences for societies and natural systems. Examples include increase in the frequency, intensity, or consequences of heat waves, floods, droughts, wildfires or tropical cyclones. The study authors point to new and stronger evidence of the likelihood and likely impacts of such changes, such as the IPCC Fourth Assessment Report conclusion that it is now "more likely than not" that human activity has contributed to observed increases in heat waves, intense precipitation events, and intensity of tropical cyclones.
  • Distribution of impacts, which concern disparities of impacts, i.e. whether the poor are more vulnerable than the wealthy. Some regions, countries, and populations face greater harm from climate change while other regions, countries, or populations would be much less harmed - and some may benefit. The researchers find, for example, there is increased evidence that low-latitude and less-developed areas generally face greater risk than higher latitude and more developed countries and there will likely be disparate impacts even for different groups within developed countries.
  • Aggregate damages, which covers comprehensive measures of impacts from climate change. Impacts distributed across the globe can be aggregated into a single metric such as monetary damages, lives affected, or lives lost. The study authors determine that it is likely there will be higher damages for increases in average global temperature then previously thought, and climate change over the next century will likely adversely impact hundreds of millions of people.
  • Risks of large-scale discontinuities, which represent the likelihood that certain phenomena (sometimes called singularities or tipping points) would occur, any of which may be accompanied by very large impacts, such as the melting of major ice sheets. There is now better understanding that the risk of additional contributions to sea level rise from melting of both the Greenland and possibly Antarctic ice sheets may be larger than projected by ice sheet models assessed in the AR4, and that several meters of additional sea level rise could occur on century time scales.

The United Nations Framework Convention on Climate Change, which is in force and which the United States has ratified, calls for "stabilization of greenhouse gas concentrations in the atmosphere at a level that would prevent dangerous anthropogenic interference with the climate system." That level is not defined by the Convention nor has it been clearly defined in subsequent negotiations by parties to the Convention.

One of the authors, Michael Oppenheimer, a professor of geosciences and international affairs at Princeton University's Woodrow Wilson School, said, "The more we learn about the problem, the more severe the risk becomes and the nearer it looms. Cutting emissions of the greenhouse gases promptly is the surest way to reduce the risk, and that's how governments should be responding."

A lead author, Stephen H. Schneider, Stanford University professor of biology and interdisciplinary environmental studies and Senior Fellow at the Woods Institute for the Environment, said, "We need both mitigation and adaptation policies to cope with climate change, since we must adapt to changes we cannot prevent and mitigate changes that are hard to adapt to—that is, mitigation and adaptation are complements, not trade-offs"

Another lead author, Joel B. Smith, a Vice-President at Stratus Consulting in Boulder Colorado, said, "Based on observed impacts and new research, the risks from climate change in general now appear to be greater than they did a few years ago. The current path of greenhouse gas emissions is likely to lead to a change in climate that will exceed levels which we found will cause significant adverse impacts."

Other co-authors pf the study are Gary W. Yohe, William Hare, Michael D. Mastrandrea, Anand Patwardhan, Ian Burton, Jan Corfee-Morlot, Chris. H. D. Magadza, Hans-Martin Füssel, A. Barrie Pittock, Atiq Rahman, Avelino Suarez, and Jean-Pascal van Ypersele.


Journal reference:

  1. Joel B. Smith, Stephen H. Schneider, Michael Oppenheimer, Gary W. Yohe, William Hare, Michael D. Mastrandrea, Anand Patwardhan, Ian Burton, Jan Corfee-Morlot, Chris H. D. Magadza, Hans-Martin Füssel, A. Barrie Pittock, Atiq Rahman, Avelino Suarez, and Jean-Pascal van Ypersele. Assessing dangerous climate change through an update of the Intergovernmental Panel on Climate Change (IPCC) "reasons for concern". Proceedings of the National Academy of Sciences, 2009; DOI:10.1073/pnas.0812355106
Adapted from materials provided by Stanford University, viaEurekAlert!, a service of AAAS.
Email or share this story:
Reblog this post [with Zemanta]
Read more…
The antarctic is melting w002n54 84m sea level...

Image by pyrator via Flickr

News - December 5, 2007

Thunder, Hail, Fire: What Does Climate Change Mean for the U.S.?

The regional effects range from more wildfires in the west to stronger storms in the east.

By David Biello

The U.S. heartland can look forward to hotter, wetter summers, according to the latest climate research. Global warming will cause more severe thunderstorms—convective cloud fronts that could produce wind gusts of 58 miles (93 kilometers) per hour, 0.75-inch (1.9-centimeter) size hailstones and even more frequent tornadoes—in the region, according to research led by atmospheric scientist Robert Trapp at Purdue University. At the same time, according to independent environmental consultant Kristie Ebi, heat waves like the one in Chicago that killed 700 people in 1995 will become more commonplace.

"Climate change is projected to increase the frequency, intensity and duration of heat waves in the Midwest," says Ebi, an Intergovernmental Panel on Climate Change (IPCC) report author. "In addition, heat waves are projected to be hotter."

Of course, the U.S. Midwest is not the only region of the world that is being affected by climate change. Signs of global warming are beginning to appear everywhere: from runaway ice melt in the Arctic to slowly drowning islands in the Pacific. "Changing climate conditions are already happening," says Eileen Claussen, president of the Pew Center on Global Climate Change, which today released a report on regional impacts in the U.S. "It is clear that there is an immediate need for strong national and international policy action."

The reports findings, in addition to increased heat waves, include:

Western Wildfires—The increasingly destructive and widespread fire seasons of recent years are likely to continue due to a combination of increased drought and land development encroaching on naturally burning landscapes, along with a climate change–induced fuel boom (enhanced plant growth and a shift to more woody species) exacerbated by fire-suppression efforts leading to more abundant plant matter to fuel violent blazes, according to ecologist Dominique Bachelet of Oregon State University in Corvallis and The Nature Conservancy. "The deadly combination of human behavior and climate change means we will likely see more wildfires like those in 2007," she says.

Gulf Coast Swamped—Human engineering efforts such as levees have reduced the ability of the wetlands of Louisiana and other Gulf Coast states to keep pace with subsiding land and rising sea levels, according to coastal scientist Robert Twilley of Louisiana State University in Baton Rouge. "If soil formation cannot keep pace," he says, "inundation of wetlands from rising seas will essentially drown these landscapes, and wetlands will convert to open waters." That, in turn, will make nearby communities far more vulnerable to the effects of storm surges, such as the one caused by Hurricane Katrina in 2005.

"Dead Zones" Deader—One of a number of large and growing seasonal areas in bodies of water from which all oxygen has been leeched drives the degradation of Chesapeake Bay. A "dead zone" is a place devoid of the fish and bottom dwellers, such as the crabs and other shellfish, for which the bay is famous. Marine scientist Donald Boesch, president of the University of Maryland Center for Environmental Science, warns that climate change will also complicate the already difficult task of restoring this important watershed and food source. "Climate change impacts are not straightforward," he says, "but are multiple and interactive."

And the Pew report is not the only research to examine regional impacts.

Stronger Storms—Much of the country will experience severe thunderstorms, but major eastern and southeastern cities are likely to see the largest jumps in storm frequency, according to Purdue's Trapp—a finding buttressed by a NASA study earlier this year. "Our analysis suggests the possibility of an increase of up to 100 percent or more in locations such as Atlanta and New York," the researchers wrote in this week's Proceedings of the National Academy of Sciences.

As a result, these experts say efforts to combat climate change must focus not only on reducing greenhouse gas emissions that drive global warming but also on adjusting to the changes already underway. "The challenge we have with adaptation is trying to understand the specific impacts of climate change on a region," Boesch says. Nevertheless, "adaptation is going to be essential because we cannot avoid climate change entirely."

Read more…
Variations in CO 2 , temperature and dust from...

Image via Wikipedia

100-Year Forecast: New Climate Zones Humans Have Never Seen Worst-case warming scenario may bring totally new kinds of tropical climate and cause others to disappear By JR Minkel If global warming continues unabated, many of the world's climate zones may disappear by 2100, leaving new ones in their place unlike any that exist today, according to a new study. Researchers compared existing patterns of temperature and precipitation with those that may exist at the turn of the century, based on scenarios put forth in the recent report of the Intergovernmental Panel on Climate Change (IPCC). They found that if greenhouse gas emissions continue rising at the same rate, up to 39 percent of Earth's continental surface may experience totally new climates, primarily in the tropics and adjacent latitudes as warmer temperatures spread toward the poles. Researchers say the analysis was intended to more precisely gauge the ecological consequences of climate change. Studies have already estimated that species such as butterflies are creeping toward the poles at a rate of six kilometers per decade as temperatures rise. Some species, however, may not be able to keep pace with future changes potentially leading to new regional ecosystems as novel climate patterns emerge, possibly leading to extinctions if some climates disappear entirely. To evaluate the range of possible outcomes, ecologists John Williams of the University of Wisconsin–Madison, and Stephen Jackson of the University of Wyoming, along with U.W. Madison climatologist John Kutzbach compared global climate projections published last month by the fourth IPCC with current regional climates, looking specifically at average summer and winter temperatures and precipitation. They considered scenarios of either unchecked greenhouse gas emissions or a global reduction in the rate of emissions growth. They found that the business-as-usual scenario comes with large climate changes the world over and would create entirely new patterns of temperature and precipitation for 12 to 39 percent of Earth's land area. An additional 10 to 48 percent of land would see its climate zones disappear, replaced by patterns of temperature and precipitation now occurring elsewhere, such as rain forest becoming savanna or evergreen forest becoming deciduous. In the reduced-emissions scenario, the group reports that the two kinds of change would each take hold over 4 to 20 percent of land. In the case of unchecked emissions, "we are going to be seeing climates that certainly are completely outside the range of modern human experience," Jackson says. According to the analysis, new climates would be most dramatic in the rain forests of the Amazon and Indonesia, but would extend as far toward the poles as the American southeast. Climate disappearance would occur in tropical mountains and near the poles, including regions such as the Andes, the African highlands, Indonesia and the Philippines, parts of the Himalayas and near the Arctic. With nowhere to go, species in these regions might become extinct, the group notes in this week's Proceedings of the National Academy of Sciences USA. Jackson says that prior studies have concentrated on ecological changes closer to the poles, but the tropical changes might be more dramatic. "If [the climate of] Memphis moves to Chicago, we have a Memphis there to say what Chicago will look like," he says. "For an area where we don't have a modern analogue, there's really nothing to look at to say, this is what the environment will look like."
Reblog this post [with Zemanta]
Source: http://www.sciam.com/article.cfm?id=100-year-forecast-new-cli
Read more…

SWMM 5.0.001 to SWMM 5.0.014

Source: http://www.epa.gov/ednnrmrl/models/swmm/epaswmm5_updates.txt
Figure 1. SWMM 5's QA/QC Master Example Network.

Image via Wikipedia

SWMM 5.0 Update History ======================= ----------------------- Build 5.0.014 (1/21/09) ----------------------- Engine Updates Rain Gages (gage.c, table.c, error.c, error.h, and objects.h) 1. The recording interval for a rain gage is now automatically adjusted to be no greater than the smallest time interval for the gage's time series data (with a warning message written to the Status Report). 2. When two or more rain gages reference the same time series data, a fatal error message is now generated if the Rainfall Formats (intensity, volume, or cumulative volume) for the gages are not all the same. Infiltration (infil.c) 3. The Green-Ampt infiltration rate was corrected for the case when the surface becomes saturated part way through the current time step. 4. The saturated hydraulic conductivity is no longer needed by the Curve Number method to compute a regeneration rate for infiltration capacity. The latter is now set simply to the reciprocal of the user supplied drying time. Thus the CN method now requires only two param- eters (the CN and the drying time). 5. An optional monthly adjustment pattern can now be used to modify the recovery rate of infiltration capacity by month of year. The name of this pattern is specified as part of the Evaporation data. See the Help file or the Users Manual for details. (This also affects files climate.c, keywords.c, project.c, enums.h, objects.h, and text.h). Flow Routing (flowrout.c, node.c, inflow.c, link.c, and objects.h) 6. A new Minimum Slope option has been added. When this option is non- zero a computed conduit slope is not allowed to be below this value. The default is 0. (Note: the slope of a conduit whose elevation difference is below 0.001 ft is first computed using this elevation difference and then is compared to the Minimum Slope value.) (The following files were also changed for this feature: keywords.c, project.c, enums.h, globals.h, text.h). 7. An optional Baseline Time Pattern was added for external inflows at nodes. It can be used to apply a periodic adjustment to the baseline inflow value by month of year, day of week, etc. See the Help file or the Users Manual for more details. 8. Specific conduits can now be designated as Culverts and have Inlet Control flow computed for them under Dynamic Wave flow routing. 9. The rating curve used to determine flow through an Outlet can now be based on either the freeboard depth above the outlet bottom (as before) or on the head difference between the upstream and downstream nodes. 10. The calculation of the maximum outflow that a node can release over a time step should be based on the initial volume, not the final volume, at the node. 11. A problem with the program not accepting an ideal pump when the connecting upstream conduit had an adverse slope was fixed. 12. The formula used to compute conduit slope was modified to match that used by HEC-RAS. 13. A problem with the program crashing when the No Routing option was selected in combination with the Save Outflows Interface File option was fixed (see output.c). 14. Under Steady Flow and Kinematic Wave routing one can now use a Dummy conduit that connects to a node at higher elevation without having to specify an inlet offset. Dynamic Wave Flow Routing (dynwave.c, link.c, and node.c) 15. Under-relaxation of flows for pumps between iterations of the governing equations is no longer used since it can produce a solution that does not conform to the pump's operating curve. 16. Instead of the average area, the upstream weighted area that accounts for near-supercritical flow is now used in the dQ/dH term for conduits. 17. The upstream/downstream Froude numbers used to check for normal flow are now computed using hydraulic depth rather than flow depth. 18. When ponding is allowed, ponded volume is now computed from the computed nodal depth rather than adjusting the depth to accommodate the ponded volume based on the excess of inflow versus outflow. This is a return to the original method that was used up until Release 5.0.010 and makes ponding (which is actually a form of storage) consistent with the way that storage nodes are normally treated. 19. The volume at the inlet node of Type I pumps (where an implicit wet well is assumed to occur) is now determined on the basis of computed depth, just as with storage nodes, rather than computing depth from the change in volume. 20. The possible closing of tide gates on outfalls directly connected to orifice, weir, or outlet links is now correctly accounted for. Conduit Cross-Sections (xsect.c) 21. The modified baskethandle (MODBASKETHANDLE) cross-section shape was extended to allow the circular top to have any desired radius equal or greater than half the section's width. It thus becomes an upside down version of the Rectangular-Round shape. The section geometry functions for both shapes received extensive revision. Control Rules (controls.c) 22. "SIMULATION MONTH" and "SIMULATION DAY" (meaning month of the year and day of the week, respectively) have been added to the types of time conditions that can be used in a control rule condition clause. Pollutant Buildup/Washoff (subcatch.c, landuse.c, and consts.h) 23. Washoff of a user-specified initial buildup when there is no buildup function specified now works correctly. 24. The way that concentrations in runoff are combined with those from runon and direct rainfall was modified so as to produce more consistent results, especially when a BMP removal value is appled. Water Quality Routing (qualrout.c, routing.c, treatmnt.c) 25. For storage units, the finite difference form of the mass balance equation was replaced with the analytical CSTR solution. 26. An inflow rate adjustment was added when routing quality through conduits under Dynamic Wave flow routing to help lower the mass continuity error. 27. The formula for updating the hydraulic residence time (HRT) in a storage node was revised. 28. Quality routing under Steady Flow routing is now treated as a special case where the concentration within a conduit simply equals that of the upstream node. 29. Any reverse flow into the system that occurs at an Outfall node is now treated as an external inflow with respect to water quality and will therefore contain whatever pollutant concentration was specified for external inflows at the node even if no external flow inflow was defined. This feature can be used to model saltwater or contaminant intrusion in tidally influenced channels. Groundwater (gwater.c): 30. The mass balance equations were re-formulated in a simpler fashion. 31. The flow equation was re-expressed in terms of distances above the aquifer bottom instead of absolute elevations. 32. The equation for computing the maximum infiltration rate that the upper zone can accept was corrected. Snowmelt (snow.c) 33. Snow removal for a subcatchment now works by removing snow once the "Depth at which removal begins" is reached. The fraction of this amount that remains on the surface is whatever is left over after all of the redistribution options are satisfied. 34. The "Depth at which removal begins" value is now correctly converted to internal units of feet. RDII (rdii.c) 35. A problem with no RDII being produced when two or more RDII unit hydrographs utilized the same rain gage was fixed. Time Series (table.c, error.c, error.h, objects.h) 36. Time Series data can now be imported from an external file instead of having to be listed in the project's input file. See the Users Manual or the Help file for details. Simulation Options 37. A user can now choose to ignore any combination of the following process models when running a simulation: Rainfall/Runoff, Snowmelt, Groundwater, Flow Routing and Water Quality (swmm5.c, project.c, runoff.c, subcatch.c, routing.c, keywords.c, keywords.h, text.h, and globals.h). Status Report (statsrpt.c) 38. The heading for the maximum flow column in the Link Flow Summary table was changed to "|Flow|" to show that the flows listed are absolute values. 39. The labels "Mgal" and "Mltrs" were replaced with "10^6 gal" and "10^6 ltr", respectively. 40. The widths for the various types of flow volume fields (e.g., runoff volume, node inflow volume, etc.) were increased in size. Binary Output File (output.c) 41. The Report Start Time written to the binary results is now adjusted to be be one reporting period prior to when the first result is reported so that the GUI uses the correct date when it displays results. Output Report (command line version) (report.c) 42. Time series tables for reported subcatchments now report Snow Depth, Groundwater Elevation, and Groundwater Flow (provided that snowmelt and groundwater processes are included in the simulation). GUI Updates: 1. Support was added for the following new engine features: a. minimum conduit slope option b. culvert designation for specific conduits c. monthly infiltration recovery Pattern d. Baseline Time Pattern for external inflows e. updated Modified Baskethandle cross-section shape f. either depth-based or head-based Outlet rating curves g. options to ignore selected process models h. use of an external file as source of time series data. 2. Regarding 1h above, the Time Series Editor dialog was modified to include the external data file option. 3. A new category of Simulation Options named Reporting has been added. When this category is selected for editing in the Data Browser, a Reporting Options dialog appears from which one can limit the number of objects whose simulation results are saved and can be reported. The default is to save results for all objects. 4. The Group Editing feature was extended to include subcatchment Snow Packs and Groundwater Flow parameters. 5. The Help -> Tutorial menu command now works correctly to launch the newer HTML version of the SWMM5 Tutorial Help file. 6. The File -> Export -> Hotstart File command now converts metric results to internal SWMM US units before saving them to the hotstart file. 7. Commas are no longer recognized as item separators when reading input files since this was causing problems when a comma was used in the ID name of an object (which is allowable). 8. The coordinates of the default natural areal depletion curve for snow packs were changed to correspond to those appearing in the National Weather Service publications on which SWMM's snow melt routines were based. 9. A problem with not loading a specified startup input file when epaswmm5.exe is launched from the command line (or from an Explorer shortcut) was fixed. 10. A problem with the simulation progress meter not displaying the correct number of elapsed days during long-term simulations was fixed. 11. A problem with Profile Plots not being updated correctly when users changed certain display options was corrected. 12. The following updates to the Profile Plot feature were made: i. The selected links are now checked to make sure that they exist and form a connected path. ii. The vertical axis scaling can now be set from the Profile Plot Options dialog. iii. The filled-in water level at junctions is now drawn only as high as the maximum junction depth (i.e., the ground surface), even if the HGL is higher. 13. A problem with copying just a single column of a Tabular Report to the clipboard or to a file was corrected. 14. A problem with the selection buttons on the Time Series and Tablular Report Selection dialog becoming stuck in the disabled mode was fixed. 15. If an external file (such as a rainfall climate, or interface file) resides in the same directory as the project file then the directory path portion of the file name is omitted when the file name is saved within the project file. This will make it easier to share project files with other users and computers. 16. The name of the "Rainfall" theme variable was changed to "Precipitation". 17. When the Auto-Backup program preference is selected, a backup file is now created whenever the current project file is saved to disk, not just when the project is first opened. ----------------------- Build 5.0.013 (3/11/08) ----------------------- Engine Updates: 1. The check on acceptable values for site latitude was corrected (see climate.c). 2. The definition and implementation of the PID controller was changed. See the Help file or the Users Manual for details (see controls.c). 3. The following changes were made to the dynamic wave flow routing routine in dynwave.c: a. A new method that places more weight on upstream conduit geometry as the Froude number approaches 1 was added. b. A code re-factoring error that crept into the inertial term of the momentum equation was corrected. c. The flow in a fully flowing open channel can no longer be greater than the full normal flow. d. The Normal Flow Limit based on both slope and Froude number was modified to simply implement the two criteria together in the same fashion as they are done individually. e. A check was added that prevents any flow out of a node that is dry. f. The ponding computation was reverted back to that of 5.0.009 (depth is computed from volume rather than volume computed from depth) to better maintain flow continuity. g. Using the maximum allowable change in depth at a node as a criterion for selecting a variable time step was restored. 4. The crown elevations of any connecting non-conduit links are now considered when determining a node's crown elevation (see flowrout.c). 5. The possibility that the initial setting of an orifice was not being made correctly was eliminated (see link.c). 6. Error checks were added to test for invalid numbers in a hot start file (see routing.c). GUI Updates: 1. Checks were added to test for erroneous values in an INI file that would prevent a graph from displaying properly. ---------------------- Build 5.0.012 (2/4/08) ---------------------- Engine Updates: 1. The summary results tables written to the Status Report file have been updated and expanded. See the Users Manual for more details. Code changes to support this were made to dynwave.c, flowrout.c, funcs.h, inputrpt.c (a new module), keywords.c, keywords.h, link.c, objects.h, output.c, report.c, stats.c, statsrpt.c (a new module), and text.h. 2. Conduit offsets can now be specified as an absolute elevation or, as before, a relative depth above the node invert. The same is true for the bottom of orifices, weirs, and outlets. The "Link Offsets" setting in the GUI and the corresponding LINK_OFFSETS entry in the project's input file determine which option, DEPTH or ELEVATION, is in effect. (see project.c, link.c, keywords.c, keywords.h, globals.h, and text.h). 3. A PID-type controller has been added to the types of modulated control rules that are available. See the Help file or the Users Manual for instructions on how to use this feature (see controls.c and keywords.c). 4. In the simulation results, "flooding" is now considered to occur whenever the water level exceeds the top of a node, whether ponding occurs or not. Before, flooding was only recorded when there was no ponding and node overflow was lost from the system (see dynwave.c, flowrout.c, massbal.c, node.c, stats.c, and statsrpt.c). 5. The point at which the time to drain the upper soil zone for Green-Ampt infiltration is first calculated was moved from time 0 to the time when the first rainfall period occurs. This fixes a problem where different runoff hydrographs were being produced when a project's start date was shifted slightly (see infil.c). 6. The criteria used to determine when steady state flow conditions exist were changed to more closely follow those used in SWMM 4 (see routing.c and the Help File or Users Manual for the Skip Steady Periods option). 7. The optional user-assigned maximum flow limit for conduits was made operational for all flow routing options, not just Dynamic Wave routing (see link.c). 8. SI unit conversion problems for both a pump's on/off depth settings and its pump curve slope values were fixed (see link.c). 9. The possibility that ponding could occur at the inlet (wet well) node for a Type I pump was added (see dynwave.c). 10. A mistake in the Hazen-WIlliams head loss formula for force main conduits was corrected (see forcmain.c). 11. The minimum limit of 0.0001 on flow area and hydraulic radius computed from flow depth during dynamic wave routing was removed since flow depth is already limited by this amount (see dynwave.c). 12. The flow direction test added for checking UPSTREAM CRITICAL and DOWNSTREAM CRITICAL flow conditions in dynamic wave flow routing was removed to prevent solutions from becoming stuck (see dynwave.c). 13. The use of a maximum allowable change in depth at a node as a criterion for selecting a variable time step for dynamic wave flow routing was dropped (see dynwave.c). 14. A more refined method for computing the flow across a bottom orifice at low heads was implemented. (see link.c). 15. The head loss calculation caused by flap gates in weirs was extended to orifices as well (see link.c). 16. The computation of depth as a function of area for a trapezoidal channel was extended to consider the case where the user used 0 for the side slopes (making it a rectangular channel - a holdover from SWMM 4) (see xsect.c). 17. A bug introduced in 5.0.010 that was preventing RDII from being computed for unit hydrographs that used the same rain gage as another unit hydrograph was fixed (see rdii.c and objects.h). 18. Pollutant loading from RDII was corrected to be based on the pollutant's specified RDII quality rather than its rainfall quality (see routing.c). 19. The "Snow Only" option for the buildup of a pollutant was never actually implemented and has now been added (see subcatch.c). 20. Additional error checking for valid snow melt and snow pack input parameters was added (see snow.c, error.c, and error.h). 21. The same runoff threshold is now used for both pollutant washoff (when above the threshold) and buildup (when below the threshold) to avoid non-zero runoff concentrations from being reported during periods with negligible runoff (see subcatch.c). 22. The values for total system outflow and system flooding that are saved to the binary results file at each reporting time step are now set equal to the same values that are used for computing the overall flow continuity error, thus avoiding inconsistent system outflow values being generated for some data sets (see output.c). 23. For the command line version of SWMM, the default END_TIME option was corrected from being 24 days to 0 days (i.e., midnight of the END_DATE value) (see project.c and swmm5.c). GUI Updates: 1. The Status Bar on the bottom of the main window was given a new look, with drop down buttons added for changing the Link Offsets convention and the project's flow units. 2. A combo-box was added to the Nodes/Links page of the Project Defaults dialog to select the Link Offsets convention (in addition to the button on the Status Bar). 3. The choice of Flow Units was removed from the General Options page of the Simulations Options dialog and placed into a drop down button on the main window's Status Bar. (As before, one can also set flow units from the Nodes/Links page of the Project Defaults dialog. 4. A Bookmarks panel was added to the Status Report window to make it easier to navigate between different sections within the report. 5. A new Measurement Tool button was added to the Map Toolbar that allows one to measure the distance of a polyline or the area of a polygon drawn directly on the study area map. 6. Storage Units were added to the choice of objects that can be edited using the Group Editor dialog. 7. The length assumed for non-conduit objects displayed on a profile plot was reduced from 100 ft to 10 ft. 8. A "View Conduits Only" option was added to the Profile Plot Options dialog that makes the plot display just the water depth in the conduits along the profile and not show the HGL and ground surface. This allows one to get a better view of how full a conduit is. 9. The Project Data viewer (launched when Project | Details is selected) can now be split into two views by selecting Window | Split from its menu bar (or Window | Remove Split to remove the split view). 10. The number of decimal places set for each computed variable on the Number Formats page of the Program Preferences dialog is now saved between sessions as the other preferences are. 11. Current simulation results are now always saved between sessions (if requested by the user) even if data were modified after the last run was made. In this case, when the project is opened again, the Run Status icon will show that results are available but need updating. 12. If the user changes the display format of a Date/Time axis in the Graph Options dialog and checks the Default box in the dialog, then this format will be used for all future time series plots for the current project. 13. A problem with the Profile Plot dialog not always identifying the path of fewest links between two nodes when asked to do so was corrected. 14. Entries in the [REPORT] section of a project input file that were used to define reporting options for the command line version of SWMM 5 will no longer be lost when the project is run under the GUI version of SWMM. The GUI version simply ignores them but adds them into the project file whenever it is saved. 15. Conduit lengths and areas were always being re-computed after the study area map's dimensions or distance units were changed with the Map Dimensions dialog rather than only when the user selected the re-compute option on the dialog. 16. The backdrop map now pans to the correct position when the Edit | Find Object command is used to locate an object that is currently not in view on the staudy area map. 17. The problem of having the name of a subcatchment's outlet node or groundwater node be lost whenever that node was converted to another type using the study area map's right-click popup menu was fixed. 18. The Statistics Report analyzer was failing to include the last event in its calculations for some data sets. 19. Additional input validation was added to the Snow Pack editor form. ---------------------- Build 5.0.011 (7/16/07 ---------------------- Engine Updates: 1. A bug that prevented Weir and Outlet settings from being updated after they were changed by control rules was fixed (see link.c). 2. The control setting for a Weir was not being accounted for when computing an equivalent orifice coefficient for surcharged flow or when computing flow through a V-notch weir (see link.c). 3. The reported depth of flow through a Weir was not taking into account the Weir's control setting (see link.c). 4. An update made in 5.0.010 to how ponded depths and volumes are computed under dynamic wave flow routing was corrected (see dynwave.c). 5. The equations used to mix the quality of runon, rainfall and ponded water over a subcatchment were revised to prevent numerical instability at very low volumes (see subcatch.c). 6. Missing values in NCDC rainfall files that use the 'M' flag are now added to the total number of missing records reported (see rain.c). GUI Updates 1. A bug introduced in release 5.0.010 that neglected to place quotation marks around Map Labels and backdrop file names (which can have spaces in them) when a project was saved to file and which caused problems when the project was re-opened has been fixed. ----------------------- Build 5.0.010 (6/19/07) ----------------------- Engine Updates: 1. All "float" variables were re-declared as "doubles" (except for those variables written to binary interface files) and the engine was re-compiled using the Microsoft VC++ 2005 compiler. 2. A new NO ROUTING option was added which allows a run to ignore any flow routing and only compute runoff (see swmm5.c, keywords.c, stats.c, and enums.h). 3. A new type of pump, an Ideal Pump, was added which pumps at a rate equal to the inflow to its inlet node and does not use a pump curve (see enums.h, link.c, and flowrout.c). 4. A new type of conduit shape, a Custom Shape, was added which allows users to define their own cross-sectional geometry for closed conduits. To implement this feature, a new type of curve, a Shape Curve, was added which records how the width of the cross-section varies with height. (See keywords.c, link.c, project.c, report.c, shape.c, xsect.c, enums.h, funcs.h, globals.h, objects.h, and text.h). 5. Another new type of conduit shape, a Circular Force Main, was added. It is a circular pipe that uses either the Hazen-Williams or Darcy-Weisbach equations, instead of the Manning equation, for pressurized flow only. The Hazen-Williams C-factor or the Darcy-Weisbach roughness height is one of the shape's parameters. The choice of which equation to use (for Force Mains only) is a new global option. (See project.c, forcmain.c, dynwave.c, keywords.c, link.c, xsect.c, enums.h, globals.h and text.h). 6. Pumps can now have startup and shutoff inlet node depths supplied directly as part of a pump's properties rather than as part of a control rule. (See link.c, routing.c, objects.h, and funcs.h). 7. Orifices can now have timed gate openings and closings as in SWMM 4 (i.e., the SWMM 4 ORATE parameter). (See link.c and objects.h). 8. Unit Hydrographs used for RDII inflows can now have an initial abstraction loss associated with them. Consult the Users Manual or the Help file for details. (See rdii.c and objects.h). 9. A new criterion was added to determine when a conduit has supercritical flow and therefore normal flow conditions might apply. It is based on both water surface slope and the Froude number (as opposed to just one or the other). (See dynwave.c, project.c, keywords.c, enums.h, and text.h). 10. A Flow Instability Index is now computed for each non-pump link. It counts the number of time steps in which the link's flow is either higher or lower than the flows at the previous and next time steps. The Status Report lists the links with the five highest indexes. (See objects.h, stats.c, and report.c). 11. Node volumes are now initialized to take account of any initial ponding that may be implied by the node depth stored in a hot start file (see flowrout.c). 12. The area corrections to the inlet and outlet loss terms under dynamic wave flow routing that were introduced in Build 5.0.008 were removed (see dynwave.c). 13. To comply more closely with standard hydraulic practice, the head across an orifice is now computed with respect to the midpoint of its opening, rather than to the bottom. Also, orifices are now treated the same as weirs in terms of not contributing any surface area to their end nodes (see link.c and dynwave.c). 14. The partly opened setting for an orifice is now interpreted as fraction of the full orifice opening height available rather than as the fraction of the full area available. Also, the equivalent discharge coefficient for a partly full orifice is now re-computed whenever the setting of the orifice changes (see link.c). 15. In kinematic wave flow routing, when a conduit's inflow is limited to its maximum normal flow, its corresponding inflow area is now correctly normalized to the full flow area (see kinwave.c). 16. For dynamic wave flow routing, the criteria used to check if a node is not full before using its depth to compute a variable time step was corrected to avoid excessively small time steps (see dynwave.c). 17. The width v. depth table for circular shapes was expanded to 51 entries to match that of the other tables for this shape (see xsect.dat). 18. The number of entries in the geometry tables for irregular cross-sections was increased to 51 entries (see objects.h). 19. For Divider nodes, both end nodes of the diversion link are now checked to see if one of them is connected to the divider node (see node.c). 20. Conditions on Outlet links are now correctly recognized in control rule statements and an error message is now generated if more than one rule clause is placed on the same line (see controls.c). 21. When the Ignore Rainfall option is used, a rain gage's rainfall is now properly initialized to 0 to prevent a spurious rainfall value from being reported (see gage.c). 22. An explicit check is now made in the engine (which already exists in the GUI) to see if the ID name of the outlet of a subcatchment exists as both a node and a subcatchment. If so, then Error 108 is thrown. (See subcatch.c). 23. The column in the Node Depth Summary of the Status Report that previously displayed the total volume of ponded water at each node (but was labelled "Total Flooding") now displays the maximum volume of ponded water at each node and is labelled "Max Vol. Ponded". Also, flow values appearing in the Status Report's tables were expanded to 3 decimal places for MGD and CMS units, and an additional decimal place was added to ponded area and conduit length in the report's Input Summary tables (see stats.c and report.c). 24. When a node is ponded under dynamic wave routing, the water depth is now always set equal to the ponded depth rather than the smaller of the ponded and dynamic depths (see dynwave.c). 25. A more efficient way of processing the mathematical expressions used in treatment functions has been implemented (see mathexpr.h, mathexpr.c, and objects.h). 26. A bug in the Groundwater routine that allowed infiltration to continue even when the entire groundwater table was saturated was fixed as was a metric units conversion error on computed groundwater flow (see gwater.c). 27. The locations of the left and right overbank stations for an irregular channel transect are now adjusted by the Station Modifier multiplier, in the same way as all of the other station locations across the transect are. 28. An error in computing the flow contribution of the triangular ends of a trapezoidal weir was corrected (see link.c). 29. A roundoff error under kinematic wave and steady flow routing that sometimes caused nodes to be incorrectly reported as ponded was fixed (see flowrout.c). GUI Updates: 1. A "Tools" item was added to SWMM's main menu. The existing menu options to set Program Preferences and Map Display Options were moved there. In addition, it contains a "Configure Tools" option that can be used register add-in tools with SWMM 5. Consult the Users Manual or the Help file for more information regarding add- in tools. 2. A "None" option was added to the choice of routing methods on the General page of the Simulation Options dialog to accommodate the new No Routing analysis option. 3. The Property Editor for Pumps was modified to allow the Pump Curve field to remain blank (or accept a *) to signify the new Ideal type pump and to accept startup and shutoff depths. 4. The Property Editor for orifices was modified to include a Time To Close/Open field. 5. The Unit Hydrograph Editor dialog was modified to include the new Initial Abstraction parameters. 6. The Analysis Options dialog was modified to accommodate the new supercritical flow criterion. 7. The Cross-Section Editor and the Curve Editor were modified to accommodate the new Custom cross-section shape feature as well as the new Circular Force Main shape. 8. The File | Export menu has a new option that, once a run has been successfully made, will export the node and link results at the current time period being viewed to a Hotstart file. 9. The popup menu for toggling the map's Auto-Length feature was replaced with a check box on the Status Panel. 10. A check box was added to the Map Dimensions dialog to ask if conduit lengths and subcatchment areas should be recomputed when the Auto- Length setting is on. 11. The Group Delete feature now offers the option of only deleting objects with a specific value for their Tag property. 12. Ponded Area was added to the list of node parameters that can be assigned a default value through the Project >> Defaults menu item. 13. The epaswmm5.ini file that contains a user's program preferences is now saved to the users Application Data folder, in a sub-folder named EPASWMM, rather than to the user's home folder. 14. Conduit slopes are no longer displayed as absolute values, so that negative slopes will show up on a thematic display on the study area map and will also be identified when a map query is made. 15. The bitmap image on the Run speed button was replaced. 16. The automatic identification of a connected path of links between two nodes specified on the Profile Plot dialog now uses the path with the smallest number of links. 17. The Study Area Map's Zoom Out feature no longer uses a zoom out to previous extent. Instead it zooms out relative to the current center of the map. 18. The Animator toolbar was made a permanent part of the Map Browser panel. 19. The operation of the date and time controls on the Map Browser panel were modified to work correctly with reporting times that are larger than 1 day. 20. The options on the Map Query dialog were extended to allow one to identify all nodes on the map that have been assigned a particular type of external inflow (Direct, Dry Weather, RDII, or Groundwater). ----------------------- Build 5.0.009 (9/19/06) ----------------------- Engine Updates: 1. A climate file in the user-prepared format will no longer be confused with one using the Canadian format (see climate.c). 2. The minimum runoff which can generate pollutant washoff was changed from 0.001 in/hr to 0.001 cfs (see subcatch.c). 3. A new RDII event now begins when the duration of a continuous run of dry weather exceeds the base time of the longest unit hydrograph rather than arbitrarily being set at 12 hours (see rdii.c). 4. Problems with dynamic flow routing through long force mains connected to Type 3 and Type 4 pumps have been corrected (see dynwave.c and link.c). GUI Updates: 1. A problem in displaying profile plots when all elevations are below zero has been corrected. ---------------------- Build 5.0.008 (7/5/06) ---------------------- Engine Updates: 1. The conversion from the Horton infiltration drying time input parameter to an equivalent regeneration curve constant was corrected. 2. Pipe invert elevations at outfalls are now measured relative to the outfall stage elevation rather than the outfall's invert elevation. 3. Entrance/exit minor loss terms for dynamic wave flow routing are now adjusted by the ratio of the mid-point to entrance/exit areas to improve the energy balance. 4. A possible error in computing flow depth from head when checking the normal flow limitation based on the Froude number for dynamic wave flow routing was corrected. 5. A potential problem with converting the units of rainfall read from an external file was corrected. 6. The equivalent length of orifices and weirs was changed from being a minimum of 200 ft to a maximum of 200 ft. 7. Problems in displaying washoff mass balance results for pollutants expressed as Counts/Liter were fixed. 8. The reporting of total system maximum runoff rate in the Status Report's Subcatchment Runoff Summary table has been corrected. 9. The subcatchment pollutant washoff process was reprogrammed to provide more rigorous mass balance results for the case where runoff from one subcatchment is routed over another subcatchment or when there is direct deposition from rainfall. 10. Checks for non-negative conduit offsets and orifice/ weir/outlet heights have been added. 11. A constant value and a scaling factor have been added to Direct External inflows. See the Inflows Editor - Direct Page topic in the Help file for more details. 12. A listing of total washoff loads for each pollutant for each subcatchment has been added to the Status Report. 13. A new summary table of Node Inflows and Flooding has been added to the Status Report. 14. A new summary table of Outfall flows and pollutant loads has been added to the Status Report. 15. The 5.0.006 Engine Update #12 has been revoked. GUI Updates: 1. The Inflows Editor was modified to accommodate the baseline and scaling parameters added to direct external inflows. 2. The .INI file that saves a user's program preferences is now saved to the user's home directory rather than the SWMM installation directory. 3. The Select All command was extended to apply to the Status Report display. 4. A new text file viewer component was used for the Status Report to speed up the display of the report's contents. 5. A formating error on the Horizontal Axis page of the Graph Options dialog form was corrected. This required making changes to the custom Chart Dialog component that is included with the GUI's source code. 6. Some cosmetic changes were made to the look of Tabular reports. 7. Type 3 pump curves (head v. flow) are now displayed with head on the vertical axis and flow on the horizontal axis when the View option is selected in the Curve Editor dialog. ----------------------- Build 5.0.007 (3/10/06) ----------------------- Engine Updates: 1. An "Ignore Rainfall" analysis option was added that causes the program to only consider user-supplied external inflow time series and dry weather flows and ignore any rainfall inputs that would otherwise produce runoff. 2. The hydraulic radius calculations for Rectangular-Closed, Rectangular-Triangular, and Rectangular-Round conduit shapes were modified to account for the increase in wetted perimeter that occurs under full flow due to the top surface. 3. Refinements were made in several places in the code that need to distinguish between Full Flow and Maximum Flow conditions in closed conduits. 4. The code now properly accounts for the case where the depth at which the maximum normal flow occurs through an irregular shaped cross section is less than the full depth. 5. The final volume of any ponded water (caused by node flooding) is now included in the reported flow continuity error. 6. Peak runoff flow was added to the Subcatchment Summary table in the Status Report. 7. Non-conduit links are now included in the Link Flow Summary table of the Status Report. GUI Updates: 1. The Maximum Depth field in the Property Editor for a conduit with an irregular shape now shows the correct value for any set of transect elevation values. 2. The "Save Profile to File" button is now enabled when the user manually adds a specified set of links to the Profile Plot dialog. 3. Link Flow Depth and Link Velocity have been added as choices for calibration variables. 4. The way that non-conduit links are displayed on profile plots was changed to avoid problems that occurred for weirs and orifices with crest heights above the node invert. 5. A problem with the way that the Group Editing function was handling the case of irregular shaped cross sections was fixed. ------------------------- Build 5.0.006a (10/19/05) ------------------------- Engine Updates: 1. The formula for snow melt rate during periods with rainfall was corrected to return its value in ft/sec rather than in/hr. 2. A problem with generating routing interface files for systems with just nodes and no links was corrected. GUI Updates: 1. Numerical precision problems in computing centroids for subcatchments with very small distances between vertices were fixed. 2. A problem with no calibration data being shown on a time series graph when some of the data were outside the range of the graph was fixed. 3. A problem with calibration data represented as dates (not elapsed time) being shifted one reporting period over in time series graphs that used elapsed time was fixed. ---------------------- Build 5.0.006 (9/5/05) ---------------------- Engine Updates: 1. A new summary table of maximum volumes and outflow rates for each storage unit has been added to the Status Report. 2. The SWMM 4 BC parameter, which specifies a minimum groundwater table elevation for groundwater flow to occur, was added as an optional groundwater flow parameter. If not provided then as before, the invert of the receiving node defines the minimum groundwater table elevation for flow to begin. 3. A new option was added to the Action clause of a control rule that allows the control setting for pumps, orifices, weirs, and outlets to be defined either by a curve (of setting versus node depth, for example) or by a time series. See the "Modulated Controls" topic in the Help file for more details. 4. The problem with interior nodes being mistaken for outfall nodes (depending on the orientation of the connecting links) under water quality analyses was fixed. 5. Geometry tables for standard size elliptical pipes were added (the standard size code number in the input file was being mistaken for an actual dimension). 6. Storage curves of area versus depth are now linearly extrapolated when a depth exceeds the table limit (as in SWMM 4) rather than just keeping the area constant. 7. Evaporation is no longer computed from a storage unit when it becomes dry. 8. In water quality routing, concentrations in storage units are now adjusted to reflect any evaporation loss over each time step. 9. It is now permissible to use the same hotstart file to both provide initial values for a run and to save the final values from a run. 10. The code was modified to be able to read evaporation values from a climate file during runs where no runoff computations are being made (previously any evaporation in such files was being ignored in data sets with no subcatchments). 11. A problem in the way that water quality was being routed through dummy conduits was fixed. 12. For pollutant treatment functions that define fractional removal in a storage unit node as a function of concentration, the concentration used is now the inflow concentration into the node (as is done for non-storage nodes), rather than the concentration in the storage unit. 13. The global first-order decay reaction assigned to specific pollutants is not applied to any storage unit that has a treatment function defined for the pollutant. 14. The total moisture available for infiltration at each time step of the runoff process now has evaporation subtracted from it before infiltration is computed. 15. Corrections were made to the way that the water volume in the upper soil zone is depeleted during dry periods under Green- Ampt infiltration. 16. A climate file is now positioned to begin reading at the start of the simulation period (rather than the start of the file) unless the user supplies a specific starting date to begin reading from the file. 17. A fatal error is now generated if the end of a climate file is reached when seeking climate data during a run (rather than just maintaining the same climate values for the remainder of the run). 18. The Node and Conduit flow statistics that appear in the Status Report are now only collected over the reporting period of the simulation, not the entire period (as would be the case when the user specifies a Report Start Date that comes after the Simulation Start Date). 19. The computation of the initial and final groundwater storage volumes used in the Groundwater Continuity table were corrected. This error only affected the continuity numbers and not the computed flows and water table levels. GUI Updates: 1. The File >> Reopen command will now list up to 10 most recently used files. 2. Map coordinates are now displayed with 3 decimal places in the Status Bar. 3. The File >> Preferences dialog now contains a "Prompt to Save Results" option. If left unchecked, simulation results will always be saved when a project file is closed and will be available for viewing the next time the project is opened. 4. A "Report Elapsed Time by Default" option was also added to the File >> Preferences dialog. If checked, then time series graphs and tables will default to using elapsed time, rather than date/time, as the time variable. This choice can always be changed in the dialog box that appears when a graph or table is first created. 5. Additional reporting variables were added to the list of parameters for which Calibration Files can be used (e.g., groundwater elevation, node flooding, etc.). 6. Percent impervious was added to the list of subcatchment themes that can be viewed on the Study Area Map. 7. An Exceedance Frequency plot panel was added to the output produced when a Statistics report is generated. 8. Users can now add, delete, or re-position items in the list of links selected for a Profile Plot in the Profile Plot dialog using a new set of buttons added to the dialog. Links are added to the list by selecting the link either on the Map or from the Data Browser and then clicking the PLUS button on the dialog. 9. Profile Plots can now be generated before any simulation results are available. They include an Update button that allows one to update the plot after editing changes have been made to any nodes or links contained in the plot. 10. The Edit >> Find menu command (and its associated speed button) was split into two sub-commands, one for finding objects on the map (as before) and another for finding text within a Status Report. 11. Problems with the wrong data fields sometimes being updated in the Group Editor were fixed. 12. The Interface File Combine utility was not working at all (the format of the interface file had changed since the original code was written). This has been fixed. 13. The centroids of subcatchment polygons on the map are now computed as true centroids rather than being merely the average of the vertex coordinates. 14. The Maximum Depth property is now preserved when a storage unit is converted to a junction (by right-clicking on it and selecting Convert To from the popup menu). 15. Map and Profile Plot animation is now turned off whenever the Animator Toolbar is closed. 16. More universal support was provided for entering numerical values in scientific notation throughout the GUI's various data entry fields. 17. Display problems with zoom-ins on the preview plots of Transects, Curves, and Time Series in their respective Editor dialogs were fixed. 18. In the GUI source code: a. The custom TOpenTextFileDialog component was renamed to TOpenTxtFileDialog so as not to conflict with a Delphi 2005 component of the same name. b. The custom ChartDlg component was modified to add support for a chart axis that uses Date/Time labels. c. A new unit named Ucalib.pas was added that includes the code for reading data from Calibration Files that was previously contained in the Fgraph.pas unit. d. The Delphi DFM files for the project are now packaged as text files, not binaries, in the source code distribution. ------------------------ Build 5.0.005b (6/15/05) ------------------------ Engine Updates: 1. The end node offsets for conduits with the partly filled circular cross-section shape were not being increased to account for the depth of fill. 2. Flow through a weir was not necessarily zero when the water level on the side of the weir at higher head was zero. 3. The "crest height" for a Bottom Orifice is now interpreted as having the orifice lie in a horizontal plane the specified distance above its upstream node's invert. This allows riser outlet pipes in storage units to be simulated. GUI Updates: 1. The keyword "WEIR" was not being recognized as a legitimate type of Flow Divider node by the GUI's input data file parser. 2. The Profile Plot could display hydraulic grade lines that dropped below the invert of a conduit. ------------------------ Build 5.0.005a (5/25/05) ------------------------ Engine Updates: 1. An erroneous error message that appears when a node has multiple outflow links with one of them being an Outlet link has been fixed. GUI Updates: 1. Corrections were made for the way a Profile Plot is drawn when negative elevation values occur. ------------------------ Build 5.0.005 (5/20/05) ------------------------ Engine Updates: 1. An error in computing ponded depths at flooded nodes under Dynamic Wave flow routing was corrected. 2. The wrong lookup function was being used to find water elevations at Time Series type outfall nodes. 3. An error in interpolating values stored on a routing interface file was corrected. 4. The rainfall file reader was confusing the standard space- delimted format with other file formats. 5. A reporting error for rainfall time series that had no ending zero value was corrected. 6. A problem with neglecting to compute a snowmelt coefficient for pervious areas was fixed. 7. The keyword for specifying that pollutant buildup be normalized to curb length was modified to accept either CURB or CURBLENGTH. 8. The conversion factor the user supplies for external pollutant mass inflows must now convert time series values into mass concentration units per second (e.g., 5.25 will convert from lbs/ day to mg/sec). Flow units are no longer part of the conversion. 9. The ratio of maximum to design flow listed for each conduit in the status report was corrected to account for the number of barrels included in the conduit. 10. The minimum elevation change applied to a flat conduit was changed to 0.001 feet, as used in SWMM 4. 11. The maximum depth of an irregular cross-section transect is now based on the highest elevation of all stations, rather than just the higher of the first and last station, and vertical walls extending up to the higest elevation are added at the first and last station if need be. 12. The nominal width property of an irregular cross-section transect is now taken as the top width at full depth rather than the maximum width over all depths. 13. At outfalls where the user-specified water elevation is below that of a free outfall, the free outfall elevation is now used. 14. A new property, the maximum allowable flow, was added to the Conduit object. The default value is 0.0, which indicates that no maxmimum flow is prescribed. 15. Depths at outfall nodes under Steady and Kinematic Wave flow routing are now reported as the depth in the connecting conduit. 16. The calculation of the head over a non-surcharged, submerged weir was corrected to be based on the height of water above the weir crest, rather than the difference in heads on either side of the weir. 17. The equation used to reduce the length of a weir with side contractions was modified to fix a bug in SWMM 4. 18. A new water quality routing algorithm was written that produces more robust results under Dynamic Wave flow routing. 19. The Compatibility Mode option under Dynamic Wave flow routing was removed. Now there is just a single method used which has been designed to be compatible with SWMM 4 yet produce more stable results. 20. A new dynamic wave routing option was added that determines which criterion decides when conduit flow is limited to normal flow (it represents the KSUPER parameter used in SWMM 4). 21. A new flow routing option was added that allows routing calculations to be skipped during periods of steady flow which can greatly reduce the time required for continuous simulations. GUI Updates: 1. An error in reading the flapgate parameter for Weirs in an input file was corrected. 2. Having the Property Editor positioned outside the viewable screen area when the user changed the video settings to a lower resolution was corrected. 3. The Convert To option to change nodes from one type of object to another was fixed. 4. The Routing Time Step option is now entered as fractional seconds on the Analysis Options form. The older format of hrs:min:sec will still be imported correctly from previous SWMM5 input files. 5. The ability to include a startup input file on the command line that launches the GUI was added (add /f filename to the command line where filename is the fully qualified name of the input file to start with). 6. Support for output results files greater than 2 gigabytes was added. 7. The display of the hydraulic grade line in Profile Plots, and its intersection with the flow volume in conduits was improved. 8. The summary results tables contained in the Status Report were modified to display more useful information. 9. The graph options selection dialogs were made to behave more consistently. 10. Support was added for copying and printing the graphical views of curves, time series, and transects from within their respective editors. 11. The SWMM 4 flow calibration data file (Extran1.dat) distributed with the example data set Example2.inp was modified to contain the flows actually produced by SWMM version 4.4h, rather than the original numbers printed in the 1988 Extran manual. In addition, the SWMM 5.0 Users Manual and Help file were updated to reflect these changes and new additions. ------------------------ Build 5.0.004 (11/24/04) ------------------------ Engine Updates: 1. Fixes were made to the routines that identify and read data from the NCDC-formatted external rain files. 2. The sign of reported velocity in links with adverse slope was corrected. 3. Reading of results from previously saved Runoff Interface files was corrected. 4. The calculation of a regeneration rate constant from a soil drying time value for Curve Number infiltration was corrected, and the method was modified to use a constant infiltration capacity during each rain event, rather than a continuously declining capacity. 5. A correction was made to the dynamic wave routing routine for SWMM4 and SWMM3 compatibility modes that improves the match with Extran results from these earlier versions of SWMM. 6. The check for zero-sloped conduits was modified to include any conduit with elevation difference below 0.01 feet. 7. The computation of the ponded depth at flooded nodes under dynamic wave flow routing was corrected. 8. A check was added to make sure that the reporting time step is not longer than the run duration. 9. Surcharged and high Froude number conduits were previously excluded from consideration when computing a variable time step for dynamic wave routing; they are now included. 10. The code numbers for the concentration units used for each pollutant was added to the binary output file produced from a simulation. GUI Updates: 1. Negative values can now be entered for temperature values that appear on several input forms. 2. The input file reader now checks to make sure that the various time- of-day option values are valid. 3. A problem with copying the correct dates for a Tabular Report that is being copied to the clipboard or to a file was corrected. 4. The Graph Options dialog form was modified to display the Solid option for Style whenever a Size greater than 1 is selected. (Due to a limitation of the Graphics library used in EPA SWMM, only solid lines can be drawn at a thickness greater than 1.) ------------------------ Build 5.0.003 (11/10/04) ------------------------ Engine Updates: 1. Modifications were made to full depth entries of width tables for closed rounded cross-section shapes to improve the numerical stability for dynamic wave flow routing. 2. Error 405 was added to detect if the size of the binary results file would exceed the 2.1 Gbyte system limit. 3. A units problem for RDII inflows under metric flow units was corrected. 4. A problem reading the TEMPDIR option when it contained spaces was corrected. 5. Support for Canadian DLY02 and DLY04 temperature files was added. 6. Rule-based control of crest height for weirs was corrected (previously the control setting adjusted flow rather than the relative distance between weir crest and crown). GUI Updates: 1. A problem with the Group Editing feature for conduits was corrected (the editor would update the wrong conduit parameter). 2. Execution time for long term simulations on smaller projects was speeded up considerably by only refreshing the progress meter every day rather than every minute. 3. The time to draw time series graphs and perform statistical analyses on large data sets was considerably shortened. ----------------------- Build 5.0.002 (11/1/04) ----------------------- Engine Updates 1. Modifications made to the Picard method used for dynamic wave flow routing routine. ------------------------ Build 5.0.001 (10/29/04) ------------------------ First official release of SWMM 5.
Reblog this post [with Zemanta]
Read more…

Saving Calibration Data from SWMM 5

SWMM 5 Calibration Files

Topic: There are a lot of very good methods for importing different types of Calibration data into InfoSWMM, H20MAP SWMM and SWMM 5 but there is not a lot of good methods for generating this data. I have used a few modified routines in the Delphi Code of SWMM 5 to generate a calibration file in either Elapsed Time or as a Date/Time for 4 Node data types, 4 Link data types and 4 Subcatchment data types. I find it useful for testing the different SWMM 5 routing options and showing differences between different SWMM 5 versions. The code works with any SWMM 5 binary output file.
Steps for making calibration files from the SWMM 5.

Step 1. Run the model and graph at least one Object class such as Nodes, Links or Subcatchments


Step 2: Use the Command Copy To to bring up the Saving Selection Dialog


Step 3. Select the type of Calibration File you want based on the Selection List


Step 4: Go to the Calibration Data Selection Menu


Step 5: Select the correct type of Calibration Data


Step 6: Click on the Edit Button and paste the data you saved to the clipboard into the Text Box


Step 7: Graph with the Calibration Data


Step 8: Graph with the Calibration Data in Date/Time Format


Step 9: Graph with the Calibration Data in Date/Time Format


Reblog this post [with Zemanta]
Read more…

THE OPEN UNIVERSE

The four mechanisms of speciation.

Image via Wikipedia

STUART KAUFFMAN Director, The Institute for Biocomplexity and Informatics, The University of Calgary; Author, Reinventing the Sacred THE OPEN UNIVERSE John Brockman's question is dramatic: What will change everything? Of course, no one knows. But the fact that no one knows may be the feature of our lives and the universe that does change everything. Reductionism has reigned as our dominant world view for 350 years in Western society. Physicist Steven Weinberg states that when the science shall have been done, all the explanatory arrows will point downward, from societies to people, to organs, to cells, to biochemistry, to chemistry and ultimately to physics and the final theory. I think he is wrong: the evolution of the biosphere, the economy, our human culture and perhaps aspects of the abiotic world, stand partially free of physical law and are not entailed by fundamental physics. The universe is open. Many physicists now doubt the adequacy of reductionism, including Philip Anderson, and Robert Laughlin. Laughlin argues for laws of organization that need not derive from the fundamental laws of physics. I give one example. Consider a sufficiently diverse collection of molecular species, such as peptides, RNA, or small molecules, that can undergo reactions and are also candidates to catalyze those very reactions. It can be shown analytically that at a sufficient diversity of molecular species and reactions, so many of these reactions are expected to be catalyzed by members of the system that a giant catalyzed reaction network arises that is collectively autocatalytic. It reproduces itself. The central point about the autocatalytic set theory is that it is a mathematical theory, not reducible to the laws of physics, even if any specific instantiation of it requires actual physical "stuff". It is a law of organization that may play a role in the origin of life. Consider next the number of proteins with 200 amino acids: 20 to the 200th power. Were the 10 to the 80th particles in the known universe doing nothing but making proteins length 200 on the Planck time scale, and the universe is some 10 to the 17th seconds old, it would require 10 to the 39th lifetimes of the universe to make all possible proteins length 200 just once. But this means that, above the level of atoms, the universe is on a unique trajectory. It is vastly non-ergodic. Then we will never make all complex molecules, organs, organisms, or social systems. In this second sense, the universe is indefinitely open "upward" in complexity. Consider the human heart, which evolved in the non-ergodic universe. I claim the physicist can neither deduce nor simulate the evolutionary becoming of the heart. Simulation, given all the quantum throws of the dice, for example cosmic rays from somewhere mutating genes, seems out of the question. And were such infinitely or vastly many simulations carried out there would be no way to confirm which one captured the evolution of this biosphere. Suppose we asked Darwin the function of the heart. "Pumping blood" is his brief reply. But there is more. Darwin noted that features of an organism of no selective use in the current environment might be selected in a different environment. These are called Darwinian "preadaptations" or "exaptations". Here is an example: Some fish have swim bladders, partially filled with air and partially with water, that adjust neutral bouyancy in the water column. They arose from lung fish. Water got into the lungs of some fish, and now there was a sac partially filled with air, partially filled with water, poised to become a swim bladder. Three questions arise: Did a new function arise in the biosphere? Yes, neutral bouyancy in the water column. Did it have cascading consequences for the evolution of the biosphere? Yes, new species, proteins and so forth. Now comes the essential third question: Do you think you could say ahead of time all the possible Darwinian preadaptations of all organisms alive now, or just for humans? We all seem to agree that the answer is a clear "No". Pause. We cannot say ahead of time what the possible preadaptations are. As in the first paragraph, we really do not know what will happen. Part of the problem seems to be that we cannot prespecify all possible selective environments. How would we know we had succeeded? Nor can we prespecify the feature(s) of one or several organisms that might become preadaptations. Then we can make no probability statement about such preadaptations: We do not know the space of possibilities, the sample space, so can construct no probability measure. Can we have a natural law that describes the evolution of the swim bladder? If a natural law is a compact description available beforehand, the answer seems a clear No. But then it is not true that the unfolding of the universe is entirely describable by natural law. This contradicts our views since Descartes, Galileo and Newton. The unfolding of the universe seems to be partially lawless. In its place is a radically creative becoming. Let me point to the Adjacent Possible of the biosphere. Once there were lung fish, swim bladders were in the Adjacent Possible of the biosphere. Before there were multicelled organisms, the swim bladder was not in the Adjacent Possible of the biosphere. Something wonderful is happening right in front of us: When the swim bladder arose it was of selective advantage in its context. It changed what was Actual in the biosphere, which in turn created a new Adjacent Possible of the biosphere. The biosphere self consistently co-constructs itself into its every changing, unstatable Adjacent Possible. If the becoming of the swim bladder is partially lawless, it certainly is not entailed by the fundamental laws of physics, so cannot be deduced from physics. Then its existence in the non-ergodic universe requires an explanation that cannot be had by that missing entailment. The universe is open. Part of the explanation rests in the fact that life seems to be evolving ever more positive sum games. As organismic diversity increases, and the "features" per organism increase, there are more ways for selection to select for mutualisms that become the conditions of joint existence in the universe. The humming bird, sticking her beak in the flower for nectar, rubs pollen off the flower, flies to a next flower for nectar, and pollen rubs off on the stamen of the next flower, pollinating the flower. But these mutualistic features are the very conditions of one another's existence in the open universe. The biosphere is rife with mutualisms. In biologist Scott Gilbert's fine phrase, these are codependent origination—an ancient Buddhist phrase. In this open universe, beyond entailment by fundamental physics, we have partial lawlessness, ceaseless creativity, and forever co-dependent origination that changes the Actual and the ever new Adjacent Possible we ceaselessly self-consistently co-construct. More, the way this unfolds is neither fully lawful, nor is it random. We need to re-envision ourselves and the universe.
Reblog this post [with Zemanta]
Read more…

SWMM 5 Build 5.0.015

SWMM 5.0 Update History ======================= ----------------------- Build 5.0.015 (4/10/09) ----------------------- Engine Updates 1. Storage unit nodes have a new optional property named Infiltration that can store Green-Ampt infiltration parameters for the unit and thus allow it to serve as an infiltration basin. The Green-Ampt infiltration model was modified to explicitly include the effect of ponded water depth on infiltration rate. (See infil.c, massbal.c, node.c, and objects.h). 2. Different sets of Initial Abstraction parameters (maximum depth, initial depth, and recovery rate) can now be specified for each of the three unit hydrographs (short term, medium term, and long term) that comprise an RDII Unit Hydrograph group (see keywords.h, keywords.c, objects.h, rdii.c, and text.h). 3. A Meander Modifier was added to a Transect's parameters. It is the ratio of the length of a meandering main channel to the length of the overbank area that surrounds it. This modifier is applied to all conduits that use this particular transect for their cross section. It assumes that the length supplied for these conduits is that of the longer main channel. SWMM will use the shorter overbank length in its calculations while internally increasing the main channel roughness to account for its longer length. (See dynwave.c, flowrout.c, link.c, objects.h, and transect.c). 4. NWS files in space delimited TD 3240 or 3260 format that include a station name field have been added to the types of rainfall files that are automatically recognized by SWMM (see rain.c). 5. The 2 GB binary output file size limit for runs made under the GUI that was inadvertently added into release 5.0.014 was removed (see output.c). 6. Any backflow that flows into an outfall node due to the head condition at the node is now correctly reported as part of the node's Total Inflow result (see node.c). 7. A fatal error is now generated if the smallest time interval between values in a rainfall time series does not match the recording time interval specified for the associated rain gage object (instead of internally adjusting the gage interval and issuing a warning message) (see error.c, error.h, and gage.c). 8. The normal flow limitation for dynamic wave flow routing based on the Froude number now requires that the latter be greater or equal to 1.0 for both the upstream and downstream flow depths rather just for either of these (see dynwave.c). 9. An reporting error for the overflow rate into the ponded volume for a node that floods under dynamic wave flow routing was corrected (see dynwave.c). 10. The practice of not allowing a computed top surface width to be less than the width at 4% of the full conduit depth for dynamic wave flow routing has been dropped in favor of using the actual width, no matter how small (see dynwave.c). GUI Updates 1. Data entry forms were modified to support the new modeling features described in the Engine Updates items (1) - (3). 2. A problem with the way that conduits with elevation offsets were displayed in profile plots drawn prior to a run was corrected. ----------------------- Build 5.0.014 (1/21/09) ----------------------- Engine Updates Rain Gages (gage.c, table.c, error.c, error.h, and objects.h) 1. The recording interval for a rain gage is now automatically adjusted to be no greater than the smallest time interval for the gage's time series data (with a warning message written to the Status Report). 2. When two or more rain gages reference the same time series data, a fatal error message is now generated if the Rainfall Formats (intensity, volume, or cumulative volume) for the gages are not all the same. Infiltration (infil.c) 3. The Green-Ampt infiltration rate was corrected for the case when the surface becomes saturated part way through the current time step. 4. The saturated hydraulic conductivity is no longer needed by the Curve Number method to compute a regeneration rate for infiltration capacity. The latter is now set simply to the reciprocal of the user supplied drying time. Thus the CN method now requires only two param- eters (the CN and the drying time). 5. An optional monthly adjustment pattern can now be used to modify the recovery rate of infiltration capacity by month of year. The name of this pattern is specified as part of the Evaporation data. See the Help file or the Users Manual for details. (This also affects files climate.c, keywords.c, project.c, enums.h, objects.h, and text.h). Flow Routing (flowrout.c, node.c, inflow.c, link.c, and objects.h) 6. A new Minimum Slope option has been added. When this option is non- zero a computed conduit slope is not allowed to be below this value. The default is 0. (Note: the slope of a conduit whose elevation difference is below 0.001 ft is first computed using this elevation difference and then is compared to the Minimum Slope value.) (The following files were also changed for this feature: keywords.c, project.c, enums.h, globals.h, text.h). 7. An optional Baseline Time Pattern was added for external inflows at nodes. It can be used to apply a periodic adjustment to the baseline inflow value by month of year, day of week, etc. See the Help file or the Users Manual for more details. 8. Specific conduits can now be designated as Culverts and have Inlet Control flow computed for them under Dynamic Wave flow routing. 9. The rating curve used to determine flow through an Outlet can now be based on either the freeboard depth above the outlet bottom (as before) or on the head difference between the upstream and downstream nodes. 10. The calculation of the maximum outflow that a node can release over a time step should be based on the initial volume, not the final volume, at the node. 11. A problem with the program not accepting an ideal pump when the connecting upstream conduit had an adverse slope was fixed. 12. The formula used to compute conduit slope was modified to match that used by HEC-RAS. 13. A problem with the program crashing when the No Routing option was selected in combination with the Save Outflows Interface File option was fixed (see output.c). 14. Under Steady Flow and Kinematic Wave routing one can now use a Dummy conduit that connects to a node at higher elevation without having to specify an inlet offset. Dynamic Wave Flow Routing (dynwave.c, link.c, and node.c) 15. Under-relaxation of flows for pumps between iterations of the governing equations is no longer used since it can produce a solution that does not conform to the pump's operating curve. 16. Instead of the average area, the upstream weighted area that accounts for near-supercritical flow is now used in the dQ/dH term for conduits. 17. The upstream/downstream Froude numbers used to check for normal flow are now computed using hydraulic depth rather than flow depth. 18. When ponding is allowed, ponded volume is now computed from the computed nodal depth rather than adjusting the depth to accommodate the ponded volume based on the excess of inflow versus outflow. This is a return to the original method that was used up until Release 5.0.010 and makes ponding (which is actually a form of storage) consistent with the way that storage nodes are normally treated. 19. The volume at the inlet node of Type I pumps (where an implicit wet well is assumed to occur) is now determined on the basis of computed depth, just as with storage nodes, rather than computing depth from the change in volume. 20. The possible closing of tide gates on outfalls directly connected to orifice, weir, or outlet links is now correctly accounted for. Conduit Cross-Sections (xsect.c) 21. The modified baskethandle (MODBASKETHANDLE) cross-section shape was extended to allow the circular top to have any desired radius equal or greater than half the section's width. It thus becomes an upside down version of the Rectangular-Round shape. The section geometry functions for both shapes received extensive revision. Control Rules (controls.c) 22. "SIMULATION MONTH" and "SIMULATION DAY" (meaning month of the year and day of the week, respectively) have been added to the types of time conditions that can be used in a control rule condition clause. Pollutant Buildup/Washoff (subcatch.c, landuse.c, and consts.h) 23. Washoff of a user-specified initial buildup when there is no buildup function specified now works correctly. 24. The way that concentrations in runoff are combined with those from runon and direct rainfall was modified so as to produce more consistent results, especially when a BMP removal value is appled. Water Quality Routing (qualrout.c, routing.c, treatmnt.c) 25. For storage units, the finite difference form of the mass balance equation was replaced with the analytical CSTR solution. 26. An inflow rate adjustment was added when routing quality through conduits under Dynamic Wave flow routing to help lower the mass continuity error. 27. The formula for updating the hydraulic residence time (HRT) in a storage node was revised. 28. Quality routing under Steady Flow routing is now treated as a special case where the concentration within a conduit simply equals that of the upstream node. 29. Any reverse flow into the system that occurs at an Outfall node is now treated as an external inflow with respect to water quality and will therefore contain whatever pollutant concentration was specified for external inflows at the node even if no external flow inflow was defined. This feature can be used to model saltwater or contaminant intrusion in tidally influenced channels. Groundwater (gwater.c): 30. The mass balance equations were re-formulated in a simpler fashion. 31. The flow equation was re-expressed in terms of distances above the aquifer bottom instead of absolute elevations. 32. The equation for computing the maximum infiltration rate that the upper zone can accept was corrected. Snowmelt (snow.c) 33. Snow removal for a subcatchment now works by removing snow once the "Depth at which removal begins" is reached. The fraction of this amount that remains on the surface is whatever is left over after all of the redistribution options are satisfied. 34. The "Depth at which removal begins" value is now correctly converted to internal units of feet. RDII (rdii.c) 35. A problem with no RDII being produced when two or more RDII unit hydrographs utilized the same rain gage was fixed. Time Series (table.c, error.c, error.h, objects.h) 36. Time Series data can now be imported from an external file instead of having to be listed in the project's input file. See the Users Manual or the Help file for details. Simulation Options 37. A user can now choose to ignore any combination of the following process models when running a simulation: Rainfall/Runoff, Snowmelt, Groundwater, Flow Routing and Water Quality (swmm5.c, project.c, runoff.c, subcatch.c, routing.c, keywords.c, keywords.h, text.h, and globals.h). Status Report (statsrpt.c) 38. The heading for the maximum flow column in the Link Flow Summary table was changed to "|Flow|" to show that the flows listed are absolute values. 39. The labels "Mgal" and "Mltrs" were replaced with "10^6 gal" and "10^6 ltr", respectively. 40. The widths for the various types of flow volume fields (e.g., runoff volume, node inflow volume, etc.) were increased in size. Binary Output File (output.c) 41. The Report Start Time written to the binary results is now adjusted to be be one reporting period prior to when the first result is reported so that the GUI uses the correct date when it displays results. Output Report (command line version) (report.c) 42. Time series tables for reported subcatchments now report Snow Depth, Groundwater Elevation, and Groundwater Flow (provided that snowmelt and groundwater processes are included in the simulation). GUI Updates: 1. Support was added for the following new engine features: a. minimum conduit slope option b. culvert designation for specific conduits c. monthly infiltration recovery Pattern d. Baseline Time Pattern for external inflows e. updated Modified Baskethandle cross-section shape f. either depth-based or head-based Outlet rating curves g. options to ignore selected process models h. use of an external file as source of time series data. 2. Regarding 1h above, the Time Series Editor dialog was modified to include the external data file option. 3. A new category of Simulation Options named Reporting has been added. When this category is selected for editing in the Data Browser, a Reporting Options dialog appears from which one can limit the number of objects whose simulation results are saved and can be reported. The default is to save results for all objects. 4. The Group Editing feature was extended to include subcatchment Snow Packs and Groundwater Flow parameters. 5. The Help -> Tutorial menu command now works correctly to launch the newer HTML version of the SWMM5 Tutorial Help file. 6. The File -> Export -> Hotstart File command now converts metric results to internal SWMM US units before saving them to the hotstart file. 7. Commas are no longer recognized as item separators when reading input files since this was causing problems when a comma was used in the ID name of an object (which is allowable). 8. The coordinates of the default natural areal depletion curve for snow packs were changed to correspond to those appearing in the National Weather Service publications on which SWMM's snow melt routines were based. 9. A problem with not loading a specified startup input file when epaswmm5.exe is launched from the command line (or from an Explorer shortcut) was fixed. 10. A problem with the simulation progress meter not displaying the correct number of elapsed days during long-term simulations was fixed. 11. A problem with Profile Plots not being updated correctly when users changed certain display options was corrected. 12. The following updates to the Profile Plot feature were made: i. The selected links are now checked to make sure that they exist and form a connected path. ii. The vertical axis scaling can now be set from the Profile Plot Options dialog. iii. The filled-in water level at junctions is now drawn only as high as the maximum junction depth (i.e., the ground surface), even if the HGL is higher. 13. A problem with copying just a single column of a Tabular Report to the clipboard or to a file was corrected. 14. A problem with the selection buttons on the Time Series and Tablular Report Selection dialog becoming stuck in the disabled mode was fixed. 15. If an external file (such as a rainfall climate, or interface file) resides in the same directory as the project file then the directory path portion of the file name is omitted when the file name is saved within the project file. This will make it easier to share project files with other users and computers. 16. The name of the "Rainfall" theme variable was changed to "Precipitation". 17. When the Auto-Backup program preference is selected, a backup file is now created whenever the current project file is saved to disk, not just when the project is first opened. ----------------------- Build 5.0.013 (3/11/08) ----------------------- Engine Updates: 1. The check on acceptable values for site latitude was corrected (see climate.c). 2. The definition and implementation of the PID controller was changed. See the Help file or the Users Manual for details (see controls.c). 3. The following changes were made to the dynamic wave flow routing routine in dynwave.c: a. A new method that places more weight on upstream conduit geometry as the Froude number approaches 1 was added. b. A code re-factoring error that crept into the inertial term of the momentum equation was corrected. c. The flow in a fully flowing open channel can no longer be greater than the full normal flow. d. The Normal Flow Limit based on both slope and Froude number was modified to simply implement the two criteria together in the same fashion as they are done individually. e. A check was added that prevents any flow out of a node that is dry. f. The ponding computation was reverted back to that of 5.0.009 (depth is computed from volume rather than volume computed from depth) to better maintain flow continuity. g. Using the maximum allowable change in depth at a node as a criterion for selecting a variable time step was restored. 4. The crown elevations of any connecting non-conduit links are now considered when determining a node's crown elevation (see flowrout.c). 5. The possibility that the initial setting of an orifice was not being made correctly was eliminated (see link.c). 6. Error checks were added to test for invalid numbers in a hot start file (see routing.c). GUI Updates: 1. Checks were added to test for erroneous values in an INI file that would prevent a graph from displaying properly. ---------------------- Build 5.0.012 (2/4/08) ---------------------- Engine Updates: 1. The summary results tables written to the Status Report file have been updated and expanded. See the Users Manual for more details. Code changes to support this were made to dynwave.c, flowrout.c, funcs.h, inputrpt.c (a new module), keywords.c, keywords.h, link.c, objects.h, output.c, report.c, stats.c, statsrpt.c (a new module), and text.h. 2. Conduit offsets can now be specified as an absolute elevation or, as before, a relative depth above the node invert. The same is true for the bottom of orifices, weirs, and outlets. The "Link Offsets" setting in the GUI and the corresponding LINK_OFFSETS entry in the project's input file determine which option, DEPTH or ELEVATION, is in effect. (see project.c, link.c, keywords.c, keywords.h, globals.h, and text.h). 3. A PID-type controller has been added to the types of modulated control rules that are available. See the Help file or the Users Manual for instructions on how to use this feature (see controls.c and keywords.c). 4. In the simulation results, "flooding" is now considered to occur whenever the water level exceeds the top of a node, whether ponding occurs or not. Before, flooding was only recorded when there was no ponding and node overflow was lost from the system (see dynwave.c, flowrout.c, massbal.c, node.c, stats.c, and statsrpt.c). 5. The point at which the time to drain the upper soil zone for Green-Ampt infiltration is first calculated was moved from time 0 to the time when the first rainfall period occurs. This fixes a problem where different runoff hydrographs were being produced when a project's start date was shifted slightly (see infil.c). 6. The criteria used to determine when steady state flow conditions exist were changed to more closely follow those used in SWMM 4 (see routing.c and the Help File or Users Manual for the Skip Steady Periods option). 7. The optional user-assigned maximum flow limit for conduits was made operational for all flow routing options, not just Dynamic Wave routing (see link.c). 8. SI unit conversion problems for both a pump's on/off depth settings and its pump curve slope values were fixed (see link.c). 9. The possibility that ponding could occur at the inlet (wet well) node for a Type I pump was added (see dynwave.c). 10. A mistake in the Hazen-WIlliams head loss formula for force main conduits was corrected (see forcmain.c). 11. The minimum limit of 0.0001 on flow area and hydraulic radius computed from flow depth during dynamic wave routing was removed since flow depth is already limited by this amount (see dynwave.c). 12. The flow direction test added for checking UPSTREAM CRITICAL and DOWNSTREAM CRITICAL flow conditions in dynamic wave flow routing was removed to prevent solutions from becoming stuck (see dynwave.c). 13. The use of a maximum allowable change in depth at a node as a criterion for selecting a variable time step for dynamic wave flow routing was dropped (see dynwave.c). 14. A more refined method for computing the flow across a bottom orifice at low heads was implemented. (see link.c). 15. The head loss calculation caused by flap gates in weirs was extended to orifices as well (see link.c). 16. The computation of depth as a function of area for a trapezoidal channel was extended to consider the case where the user used 0 for the side slopes (making it a rectangular channel - a holdover from SWMM 4) (see xsect.c). 17. A bug introduced in 5.0.010 that was preventing RDII from being computed for unit hydrographs that used the same rain gage as another unit hydrograph was fixed (see rdii.c and objects.h). 18. Pollutant loading from RDII was corrected to be based on the pollutant's specified RDII quality rather than its rainfall quality (see routing.c). 19. The "Snow Only" option for the buildup of a pollutant was never actually implemented and has now been added (see subcatch.c). 20. Additional error checking for valid snow melt and snow pack input parameters was added (see snow.c, error.c, and error.h). 21. The same runoff threshold is now used for both pollutant washoff (when above the threshold) and buildup (when below the threshold) to avoid non-zero runoff concentrations from being reported during periods with negligible runoff (see subcatch.c). 22. The values for total system outflow and system flooding that are saved to the binary results file at each reporting time step are now set equal to the same values that are used for computing the overall flow continuity error, thus avoiding inconsistent system outflow values being generated for some data sets (see output.c). 23. For the command line version of SWMM, the default END_TIME option was corrected from being 24 days to 0 days (i.e., midnight of the END_DATE value) (see project.c and swmm5.c). GUI Updates: 1. The Status Bar on the bottom of the main window was given a new look, with drop down buttons added for changing the Link Offsets convention and the project's flow units. 2. A combo-box was added to the Nodes/Links page of the Project Defaults dialog to select the Link Offsets convention (in addition to the button on the Status Bar). 3. The choice of Flow Units was removed from the General Options page of the Simulations Options dialog and placed into a drop down button on the main window's Status Bar. (As before, one can also set flow units from the Nodes/Links page of the Project Defaults dialog. 4. A Bookmarks panel was added to the Status Report window to make it easier to navigate between different sections within the report. 5. A new Measurement Tool button was added to the Map Toolbar that allows one to measure the distance of a polyline or the area of a polygon drawn directly on the study area map. 6. Storage Units were added to the choice of objects that can be edited using the Group Editor dialog. 7. The length assumed for non-conduit objects displayed on a profile plot was reduced from 100 ft to 10 ft. 8. A "View Conduits Only" option was added to the Profile Plot Options dialog that makes the plot display just the water depth in the conduits along the profile and not show the HGL and ground surface. This allows one to get a better view of how full a conduit is. 9. The Project Data viewer (launched when Project | Details is selected) can now be split into two views by selecting Window | Split from its menu bar (or Window | Remove Split to remove the split view). 10. The number of decimal places set for each computed variable on the Number Formats page of the Program Preferences dialog is now saved between sessions as the other preferences are. 11. Current simulation results are now always saved between sessions (if requested by the user) even if data were modified after the last run was made. In this case, when the project is opened again, the Run Status icon will show that results are available but need updating. 12. If the user changes the display format of a Date/Time axis in the Graph Options dialog and checks the Default box in the dialog, then this format will be used for all future time series plots for the current project. 13. A problem with the Profile Plot dialog not always identifying the path of fewest links between two nodes when asked to do so was corrected. 14. Entries in the [REPORT] section of a project input file that were used to define reporting options for the command line version of SWMM 5 will no longer be lost when the project is run under the GUI version of SWMM. The GUI version simply ignores them but adds them into the project file whenever it is saved. 15. Conduit lengths and areas were always being re-computed after the study area map's dimensions or distance units were changed with the Map Dimensions dialog rather than only when the user selected the re-compute option on the dialog. 16. The backdrop map now pans to the correct position when the Edit | Find Object command is used to locate an object that is currently not in view on the staudy area map. 17. The problem of having the name of a subcatchment's outlet node or groundwater node be lost whenever that node was converted to another type using the study area map's right-click popup menu was fixed. 18. The Statistics Report analyzer was failing to include the last event in its calculations for some data sets. 19. Additional input validation was added to the Snow Pack editor form. ---------------------- Build 5.0.011 (7/16/07 ---------------------- Engine Updates: 1. A bug that prevented Weir and Outlet settings from being updated after they were changed by control rules was fixed (see link.c). 2. The control setting for a Weir was not being accounted for when computing an equivalent orifice coefficient for surcharged flow or when computing flow through a V-notch weir (see link.c). 3. The reported depth of flow through a Weir was not taking into account the Weir's control setting (see link.c). 4. An update made in 5.0.010 to how ponded depths and volumes are computed under dynamic wave flow routing was corrected (see dynwave.c). 5. The equations used to mix the quality of runon, rainfall and ponded water over a subcatchment were revised to prevent numerical instability at very low volumes (see subcatch.c). 6. Missing values in NCDC rainfall files that use the 'M' flag are now added to the total number of missing records reported (see rain.c). GUI Updates 1. A bug introduced in release 5.0.010 that neglected to place quotation marks around Map Labels and backdrop file names (which can have spaces in them) when a project was saved to file and which caused problems when the project was re-opened has been fixed. ----------------------- Build 5.0.010 (6/19/07) ----------------------- Engine Updates: 1. All "float" variables were re-declared as "doubles" (except for those variables written to binary interface files) and the engine was re-compiled using the Microsoft VC++ 2005 compiler. 2. A new NO ROUTING option was added which allows a run to ignore any flow routing and only compute runoff (see swmm5.c, keywords.c, stats.c, and enums.h). 3. A new type of pump, an Ideal Pump, was added which pumps at a rate equal to the inflow to its inlet node and does not use a pump curve (see enums.h, link.c, and flowrout.c). 4. A new type of conduit shape, a Custom Shape, was added which allows users to define their own cross-sectional geometry for closed conduits. To implement this feature, a new type of curve, a Shape Curve, was added which records how the width of the cross-section varies with height. (See keywords.c, link.c, project.c, report.c, shape.c, xsect.c, enums.h, funcs.h, globals.h, objects.h, and text.h). 5. Another new type of conduit shape, a Circular Force Main, was added. It is a circular pipe that uses either the Hazen-Williams or Darcy-Weisbach equations, instead of the Manning equation, for pressurized flow only. The Hazen-Williams C-factor or the Darcy-Weisbach roughness height is one of the shape's parameters. The choice of which equation to use (for Force Mains only) is a new global option. (See project.c, forcmain.c, dynwave.c, keywords.c, link.c, xsect.c, enums.h, globals.h and text.h). 6. Pumps can now have startup and shutoff inlet node depths supplied directly as part of a pump's properties rather than as part of a control rule. (See link.c, routing.c, objects.h, and funcs.h). 7. Orifices can now have timed gate openings and closings as in SWMM 4 (i.e., the SWMM 4 ORATE parameter). (See link.c and objects.h). 8. Unit Hydrographs used for RDII inflows can now have an initial abstraction loss associated with them. Consult the Users Manual or the Help file for details. (See rdii.c and objects.h). 9. A new criterion was added to determine when a conduit has supercritical flow and therefore normal flow conditions might apply. It is based on both water surface slope and the Froude number (as opposed to just one or the other). (See dynwave.c, project.c, keywords.c, enums.h, and text.h). 10. A Flow Instability Index is now computed for each non-pump link. It counts the number of time steps in which the link's flow is either higher or lower than the flows at the previous and next time steps. The Status Report lists the links with the five highest indexes. (See objects.h, stats.c, and report.c). 11. Node volumes are now initialized to take account of any initial ponding that may be implied by the node depth stored in a hot start file (see flowrout.c). 12. The area corrections to the inlet and outlet loss terms under dynamic wave flow routing that were introduced in Build 5.0.008 were removed (see dynwave.c). 13. To comply more closely with standard hydraulic practice, the head across an orifice is now computed with respect to the midpoint of its opening, rather than to the bottom. Also, orifices are now treated the same as weirs in terms of not contributing any surface area to their end nodes (see link.c and dynwave.c). 14. The partly opened setting for an orifice is now interpreted as fraction of the full orifice opening height available rather than as the fraction of the full area available. Also, the equivalent discharge coefficient for a partly full orifice is now re-computed whenever the setting of the orifice changes (see link.c). 15. In kinematic wave flow routing, when a conduit's inflow is limited to its maximum normal flow, its corresponding inflow area is now correctly normalized to the full flow area (see kinwave.c). 16. For dynamic wave flow routing, the criteria used to check if a node is not full before using its depth to compute a variable time step was corrected to avoid excessively small time steps (see dynwave.c). 17. The width v. depth table for circular shapes was expanded to 51 entries to match that of the other tables for this shape (see xsect.dat). 18. The number of entries in the geometry tables for irregular cross-sections was increased to 51 entries (see objects.h). 19. For Divider nodes, both end nodes of the diversion link are now checked to see if one of them is connected to the divider node (see node.c). 20. Conditions on Outlet links are now correctly recognized in control rule statements and an error message is now generated if more than one rule clause is placed on the same line (see controls.c). 21. When the Ignore Rainfall option is used, a rain gage's rainfall is now properly initialized to 0 to prevent a spurious rainfall value from being reported (see gage.c). 22. An explicit check is now made in the engine (which already exists in the GUI) to see if the ID name of the outlet of a subcatchment exists as both a node and a subcatchment. If so, then Error 108 is thrown. (See subcatch.c). 23. The column in the Node Depth Summary of the Status Report that previously displayed the total volume of ponded water at each node (but was labelled "Total Flooding") now displays the maximum volume of ponded water at each node and is labelled "Max Vol. Ponded". Also, flow values appearing in the Status Report's tables were expanded to 3 decimal places for MGD and CMS units, and an additional decimal place was added to ponded area and conduit length in the report's Input Summary tables (see stats.c and report.c). 24. When a node is ponded under dynamic wave routing, the water depth is now always set equal to the ponded depth rather than the smaller of the ponded and dynamic depths (see dynwave.c). 25. A more efficient way of processing the mathematical expressions used in treatment functions has been implemented (see mathexpr.h, mathexpr.c, and objects.h). 26. A bug in the Groundwater routine that allowed infiltration to continue even when the entire groundwater table was saturated was fixed as was a metric units conversion error on computed groundwater flow (see gwater.c). 27. The locations of the left and right overbank stations for an irregular channel transect are now adjusted by the Station Modifier multiplier, in the same way as all of the other station locations across the transect are. 28. An error in computing the flow contribution of the triangular ends of a trapezoidal weir was corrected (see link.c). 29. A roundoff error under kinematic wave and steady flow routing that sometimes caused nodes to be incorrectly reported as ponded was fixed (see flowrout.c). GUI Updates: 1. A "Tools" item was added to SWMM's main menu. The existing menu options to set Program Preferences and Map Display Options were moved there. In addition, it contains a "Configure Tools" option that can be used register add-in tools with SWMM 5. Consult the Users Manual or the Help file for more information regarding add- in tools. 2. A "None" option was added to the choice of routing methods on the General page of the Simulation Options dialog to accommodate the new No Routing analysis option. 3. The Property Editor for Pumps was modified to allow the Pump Curve field to remain blank (or accept a *) to signify the new Ideal type pump and to accept startup and shutoff depths. 4. The Property Editor for orifices was modified to include a Time To Close/Open field. 5. The Unit Hydrograph Editor dialog was modified to include the new Initial Abstraction parameters. 6. The Analysis Options dialog was modified to accommodate the new supercritical flow criterion. 7. The Cross-Section Editor and the Curve Editor were modified to accommodate the new Custom cross-section shape feature as well as the new Circular Force Main shape. 8. The File | Export menu has a new option that, once a run has been successfully made, will export the node and link results at the current time period being viewed to a Hotstart file. 9. The popup menu for toggling the map's Auto-Length feature was replaced with a check box on the Status Panel. 10. A check box was added to the Map Dimensions dialog to ask if conduit lengths and subcatchment areas should be recomputed when the Auto- Length setting is on. 11. The Group Delete feature now offers the option of only deleting objects with a specific value for their Tag property. 12. Ponded Area was added to the list of node parameters that can be assigned a default value through the Project >> Defaults menu item. 13. The epaswmm5.ini file that contains a user's program preferences is now saved to the users Application Data folder, in a sub-folder named EPASWMM, rather than to the user's home folder. 14. Conduit slopes are no longer displayed as absolute values, so that negative slopes will show up on a thematic display on the study area map and will also be identified when a map query is made. 15. The bitmap image on the Run speed button was replaced. 16. The automatic identification of a connected path of links between two nodes specified on the Profile Plot dialog now uses the path with the smallest number of links. 17. The Study Area Map's Zoom Out feature no longer uses a zoom out to previous extent. Instead it zooms out relative to the current center of the map. 18. The Animator toolbar was made a permanent part of the Map Browser panel. 19. The operation of the date and time controls on the Map Browser panel were modified to work correctly with reporting times that are larger than 1 day. 20. The options on the Map Query dialog were extended to allow one to identify all nodes on the map that have been assigned a particular type of external inflow (Direct, Dry Weather, RDII, or Groundwater). ----------------------- Build 5.0.009 (9/19/06) ----------------------- Engine Updates: 1. A climate file in the user-prepared format will no longer be confused with one using the Canadian format (see climate.c). 2. The minimum runoff which can generate pollutant washoff was changed from 0.001 in/hr to 0.001 cfs (see subcatch.c). 3. A new RDII event now begins when the duration of a continuous run of dry weather exceeds the base time of the longest unit hydrograph rather than arbitrarily being set at 12 hours (see rdii.c). 4. Problems with dynamic flow routing through long force mains connected to Type 3 and Type 4 pumps have been corrected (see dynwave.c and link.c). GUI Updates: 1. A problem in displaying profile plots when all elevations are below zero has been corrected. ---------------------- Build 5.0.008 (7/5/06) ---------------------- Engine Updates: 1. The conversion from the Horton infiltration drying time input parameter to an equivalent regeneration curve constant was corrected. 2. Pipe invert elevations at outfalls are now measured relative to the outfall stage elevation rather than the outfall's invert elevation. 3. Entrance/exit minor loss terms for dynamic wave flow routing are now adjusted by the ratio of the mid-point to entrance/exit areas to improve the energy balance. 4. A possible error in computing flow depth from head when checking the normal flow limitation based on the Froude number for dynamic wave flow routing was corrected. 5. A potential problem with converting the units of rainfall read from an external file was corrected. 6. The equivalent length of orifices and weirs was changed from being a minimum of 200 ft to a maximum of 200 ft. 7. Problems in displaying washoff mass balance results for pollutants expressed as Counts/Liter were fixed. 8. The reporting of total system maximum runoff rate in the Status Report's Subcatchment Runoff Summary table has been corrected. 9. The subcatchment pollutant washoff process was reprogrammed to provide more rigorous mass balance results for the case where runoff from one subcatchment is routed over another subcatchment or when there is direct deposition from rainfall. 10. Checks for non-negative conduit offsets and orifice/ weir/outlet heights have been added. 11. A constant value and a scaling factor have been added to Direct External inflows. See the Inflows Editor - Direct Page topic in the Help file for more details. 12. A listing of total washoff loads for each pollutant for each subcatchment has been added to the Status Report. 13. A new summary table of Node Inflows and Flooding has been added to the Status Report. 14. A new summary table of Outfall flows and pollutant loads has been added to the Status Report. 15. The 5.0.006 Engine Update #12 has been revoked. GUI Updates: 1. The Inflows Editor was modified to accommodate the baseline and scaling parameters added to direct external inflows. 2. The .INI file that saves a user's program preferences is now saved to the user's home directory rather than the SWMM installation directory. 3. The Select All command was extended to apply to the Status Report display. 4. A new text file viewer component was used for the Status Report to speed up the display of the report's contents. 5. A formating error on the Horizontal Axis page of the Graph Options dialog form was corrected. This required making changes to the custom Chart Dialog component that is included with the GUI's source code. 6. Some cosmetic changes were made to the look of Tabular reports. 7. Type 3 pump curves (head v. flow) are now displayed with head on the vertical axis and flow on the horizontal axis when the View option is selected in the Curve Editor dialog. ----------------------- Build 5.0.007 (3/10/06) ----------------------- Engine Updates: 1. An "Ignore Rainfall" analysis option was added that causes the program to only consider user-supplied external inflow time series and dry weather flows and ignore any rainfall inputs that would otherwise produce runoff. 2. The hydraulic radius calculations for Rectangular-Closed, Rectangular-Triangular, and Rectangular-Round conduit shapes were modified to account for the increase in wetted perimeter that occurs under full flow due to the top surface. 3. Refinements were made in several places in the code that need to distinguish between Full Flow and Maximum Flow conditions in closed conduits. 4. The code now properly accounts for the case where the depth at which the maximum normal flow occurs through an irregular shaped cross section is less than the full depth. 5. The final volume of any ponded water (caused by node flooding) is now included in the reported flow continuity error. 6. Peak runoff flow was added to the Subcatchment Summary table in the Status Report. 7. Non-conduit links are now included in the Link Flow Summary table of the Status Report. GUI Updates: 1. The Maximum Depth field in the Property Editor for a conduit with an irregular shape now shows the correct value for any set of transect elevation values. 2. The "Save Profile to File" button is now enabled when the user manually adds a specified set of links to the Profile Plot dialog. 3. Link Flow Depth and Link Velocity have been added as choices for calibration variables. 4. The way that non-conduit links are displayed on profile plots was changed to avoid problems that occurred for weirs and orifices with crest heights above the node invert. 5. A problem with the way that the Group Editing function was handling the case of irregular shaped cross sections was fixed. ------------------------- Build 5.0.006a (10/19/05) ------------------------- Engine Updates: 1. The formula for snow melt rate during periods with rainfall was corrected to return its value in ft/sec rather than in/hr. 2. A problem with generating routing interface files for systems with just nodes and no links was corrected. GUI Updates: 1. Numerical precision problems in computing centroids for subcatchments with very small distances between vertices were fixed. 2. A problem with no calibration data being shown on a time series graph when some of the data were outside the range of the graph was fixed. 3. A problem with calibration data represented as dates (not elapsed time) being shifted one reporting period over in time series graphs that used elapsed time was fixed. ---------------------- Build 5.0.006 (9/5/05) ---------------------- Engine Updates: 1. A new summary table of maximum volumes and outflow rates for each storage unit has been added to the Status Report. 2. The SWMM 4 BC parameter, which specifies a minimum groundwater table elevation for groundwater flow to occur, was added as an optional groundwater flow parameter. If not provided then as before, the invert of the receiving node defines the minimum groundwater table elevation for flow to begin. 3. A new option was added to the Action clause of a control rule that allows the control setting for pumps, orifices, weirs, and outlets to be defined either by a curve (of setting versus node depth, for example) or by a time series. See the "Modulated Controls" topic in the Help file for more details. 4. The problem with interior nodes being mistaken for outfall nodes (depending on the orientation of the connecting links) under water quality analyses was fixed. 5. Geometry tables for standard size elliptical pipes were added (the standard size code number in the input file was being mistaken for an actual dimension). 6. Storage curves of area versus depth are now linearly extrapolated when a depth exceeds the table limit (as in SWMM 4) rather than just keeping the area constant. 7. Evaporation is no longer computed from a storage unit when it becomes dry. 8. In water quality routing, concentrations in storage units are now adjusted to reflect any evaporation loss over each time step. 9. It is now permissible to use the same hotstart file to both provide initial values for a run and to save the final values from a run. 10. The code was modified to be able to read evaporation values from a climate file during runs where no runoff computations are being made (previously any evaporation in such files was being ignored in data sets with no subcatchments). 11. A problem in the way that water quality was being routed through dummy conduits was fixed. 12. For pollutant treatment functions that define fractional removal in a storage unit node as a function of concentration, the concentration used is now the inflow concentration into the node (as is done for non-storage nodes), rather than the concentration in the storage unit. 13. The global first-order decay reaction assigned to specific pollutants is not applied to any storage unit that has a treatment function defined for the pollutant. 14. The total moisture available for infiltration at each time step of the runoff process now has evaporation subtracted from it before infiltration is computed. 15. Corrections were made to the way that the water volume in the upper soil zone is depeleted during dry periods under Green- Ampt infiltration. 16. A climate file is now positioned to begin reading at the start of the simulation period (rather than the start of the file) unless the user supplies a specific starting date to begin reading from the file. 17. A fatal error is now generated if the end of a climate file is reached when seeking climate data during a run (rather than just maintaining the same climate values for the remainder of the run). 18. The Node and Conduit flow statistics that appear in the Status Report are now only collected over the reporting period of the simulation, not the entire period (as would be the case when the user specifies a Report Start Date that comes after the Simulation Start Date). 19. The computation of the initial and final groundwater storage volumes used in the Groundwater Continuity table were corrected. This error only affected the continuity numbers and not the computed flows and water table levels. GUI Updates: 1. The File >> Reopen command will now list up to 10 most recently used files. 2. Map coordinates are now displayed with 3 decimal places in the Status Bar. 3. The File >> Preferences dialog now contains a "Prompt to Save Results" option. If left unchecked, simulation results will always be saved when a project file is closed and will be available for viewing the next time the project is opened. 4. A "Report Elapsed Time by Default" option was also added to the File >> Preferences dialog. If checked, then time series graphs and tables will default to using elapsed time, rather than date/time, as the time variable. This choice can always be changed in the dialog box that appears when a graph or table is first created. 5. Additional reporting variables were added to the list of parameters for which Calibration Files can be used (e.g., groundwater elevation, node flooding, etc.). 6. Percent impervious was added to the list of subcatchment themes that can be viewed on the Study Area Map. 7. An Exceedance Frequency plot panel was added to the output produced when a Statistics report is generated. 8. Users can now add, delete, or re-position items in the list of links selected for a Profile Plot in the Profile Plot dialog using a new set of buttons added to the dialog. Links are added to the list by selecting the link either on the Map or from the Data Browser and then clicking the PLUS button on the dialog. 9. Profile Plots can now be generated before any simulation results are available. They include an Update button that allows one to update the plot after editing changes have been made to any nodes or links contained in the plot. 10. The Edit >> Find menu command (and its associated speed button) was split into two sub-commands, one for finding objects on the map (as before) and another for finding text within a Status Report. 11. Problems with the wrong data fields sometimes being updated in the Group Editor were fixed. 12. The Interface File Combine utility was not working at all (the format of the interface file had changed since the original code was written). This has been fixed. 13. The centroids of subcatchment polygons on the map are now computed as true centroids rather than being merely the average of the vertex coordinates. 14. The Maximum Depth property is now preserved when a storage unit is converted to a junction (by right-clicking on it and selecting Convert To from the popup menu). 15. Map and Profile Plot animation is now turned off whenever the Animator Toolbar is closed. 16. More universal support was provided for entering numerical values in scientific notation throughout the GUI's various data entry fields. 17. Display problems with zoom-ins on the preview plots of Transects, Curves, and Time Series in their respective Editor dialogs were fixed. 18. In the GUI source code: a. The custom TOpenTextFileDialog component was renamed to TOpenTxtFileDialog so as not to conflict with a Delphi 2005 component of the same name. b. The custom ChartDlg component was modified to add support for a chart axis that uses Date/Time labels. c. A new unit named Ucalib.pas was added that includes the code for reading data from Calibration Files that was previously contained in the Fgraph.pas unit. d. The Delphi DFM files for the project are now packaged as text files, not binaries, in the source code distribution. ------------------------ Build 5.0.005b (6/15/05) ------------------------ Engine Updates: 1. The end node offsets for conduits with the partly filled circular cross-section shape were not being increased to account for the depth of fill. 2. Flow through a weir was not necessarily zero when the water level on the side of the weir at higher head was zero. 3. The "crest height" for a Bottom Orifice is now interpreted as having the orifice lie in a horizontal plane the specified distance above its upstream node's invert. This allows riser outlet pipes in storage units to be simulated. GUI Updates: 1. The keyword "WEIR" was not being recognized as a legitimate type of Flow Divider node by the GUI's input data file parser. 2. The Profile Plot could display hydraulic grade lines that dropped below the invert of a conduit. ------------------------ Build 5.0.005a (5/25/05) ------------------------ Engine Updates: 1. An erroneous error message that appears when a node has multiple outflow links with one of them being an Outlet link has been fixed. GUI Updates: 1. Corrections were made for the way a Profile Plot is drawn when negative elevation values occur. ------------------------ Build 5.0.005 (5/20/05) ------------------------ Engine Updates: 1. An error in computing ponded depths at flooded nodes under Dynamic Wave flow routing was corrected. 2. The wrong lookup function was being used to find water elevations at Time Series type outfall nodes. 3. An error in interpolating values stored on a routing interface file was corrected. 4. The rainfall file reader was confusing the standard space- delimted format with other file formats. 5. A reporting error for rainfall time series that had no ending zero value was corrected. 6. A problem with neglecting to compute a snowmelt coefficient for pervious areas was fixed. 7. The keyword for specifying that pollutant buildup be normalized to curb length was modified to accept either CURB or CURBLENGTH. 8. The conversion factor the user supplies for external pollutant mass inflows must now convert time series values into mass concentration units per second (e.g., 5.25 will convert from lbs/ day to mg/sec). Flow units are no longer part of the conversion. 9. The ratio of maximum to design flow listed for each conduit in the status report was corrected to account for the number of barrels included in the conduit. 10. The minimum elevation change applied to a flat conduit was changed to 0.001 feet, as used in SWMM 4. 11. The maximum depth of an irregular cross-section transect is now based on the highest elevation of all stations, rather than just the higher of the first and last station, and vertical walls extending up to the higest elevation are added at the first and last station if need be. 12. The nominal width property of an irregular cross-section transect is now taken as the top width at full depth rather than the maximum width over all depths. 13. At outfalls where the user-specified water elevation is below that of a free outfall, the free outfall elevation is now used. 14. A new property, the maximum allowable flow, was added to the Conduit object. The default value is 0.0, which indicates that no maxmimum flow is prescribed. 15. Depths at outfall nodes under Steady and Kinematic Wave flow routing are now reported as the depth in the connecting conduit. 16. The calculation of the head over a non-surcharged, submerged weir was corrected to be based on the height of water above the weir crest, rather than the difference in heads on either side of the weir. 17. The equation used to reduce the length of a weir with side contractions was modified to fix a bug in SWMM 4. 18. A new water quality routing algorithm was written that produces more robust results under Dynamic Wave flow routing. 19. The Compatibility Mode option under Dynamic Wave flow routing was removed. Now there is just a single method used which has been designed to be compatible with SWMM 4 yet produce more stable results. 20. A new dynamic wave routing option was added that determines which criterion decides when conduit flow is limited to normal flow (it represents the KSUPER parameter used in SWMM 4). 21. A new flow routing option was added that allows routing calculations to be skipped during periods of steady flow which can greatly reduce the time required for continuous simulations. GUI Updates: 1. An error in reading the flapgate parameter for Weirs in an input file was corrected. 2. Having the Property Editor positioned outside the viewable screen area when the user changed the video settings to a lower resolution was corrected. 3. The Convert To option to change nodes from one type of object to another was fixed. 4. The Routing Time Step option is now entered as fractional seconds on the Analysis Options form. The older format of hrs:min:sec will still be imported correctly from previous SWMM5 input files. 5. The ability to include a startup input file on the command line that launches the GUI was added (add /f filename to the command line where filename is the fully qualified name of the input file to start with). 6. Support for output results files greater than 2 gigabytes was added. 7. The display of the hydraulic grade line in Profile Plots, and its intersection with the flow volume in conduits was improved. 8. The summary results tables contained in the Status Report were modified to display more useful information. 9. The graph options selection dialogs were made to behave more consistently. 10. Support was added for copying and printing the graphical views of curves, time series, and transects from within their respective editors. 11. The SWMM 4 flow calibration data file (Extran1.dat) distributed with the example data set Example2.inp was modified to contain the flows actually produced by SWMM version 4.4h, rather than the original numbers printed in the 1988 Extran manual. In addition, the SWMM 5.0 Users Manual and Help file were updated to reflect these changes and new additions. ------------------------ Build 5.0.004 (11/24/04) ------------------------ Engine Updates: 1. Fixes were made to the routines that identify and read data from the NCDC-formatted external rain files. 2. The sign of reported velocity in links with adverse slope was corrected. 3. Reading of results from previously saved Runoff Interface files was corrected. 4. The calculation of a regeneration rate constant from a soil drying time value for Curve Number infiltration was corrected, and the method was modified to use a constant infiltration capacity during each rain event, rather than a continuously declining capacity. 5. A correction was made to the dynamic wave routing routine for SWMM4 and SWMM3 compatibility modes that improves the match with Extran results from these earlier versions of SWMM. 6. The check for zero-sloped conduits was modified to include any conduit with elevation difference below 0.01 feet. 7. The computation of the ponded depth at flooded nodes under dynamic wave flow routing was corrected. 8. A check was added to make sure that the reporting time step is not longer than the run duration. 9. Surcharged and high Froude number conduits were previously excluded from consideration when computing a variable time step for dynamic wave routing; they are now included. 10. The code numbers for the concentration units used for each pollutant was added to the binary output file produced from a simulation. GUI Updates: 1. Negative values can now be entered for temperature values that appear on several input forms. 2. The input file reader now checks to make sure that the various time- of-day option values are valid. 3. A problem with copying the correct dates for a Tabular Report that is being copied to the clipboard or to a file was corrected. 4. The Graph Options dialog form was modified to display the Solid option for Style whenever a Size greater than 1 is selected. (Due to a limitation of the Graphics library used in EPA SWMM, only solid lines can be drawn at a thickness greater than 1.) ------------------------ Build 5.0.003 (11/10/04) ------------------------ Engine Updates: 1. Modifications were made to full depth entries of width tables for closed rounded cross-section shapes to improve the numerical stability for dynamic wave flow routing. 2. Error 405 was added to detect if the size of the binary results file would exceed the 2.1 Gbyte system limit. 3. A units problem for RDII inflows under metric flow units was corrected. 4. A problem reading the TEMPDIR option when it contained spaces was corrected. 5. Support for Canadian DLY02 and DLY04 temperature files was added. 6. Rule-based control of crest height for weirs was corrected (previously the control setting adjusted flow rather than the relative distance between weir crest and crown). GUI Updates: 1. A problem with the Group Editing feature for conduits was corrected (the editor would update the wrong conduit parameter). 2. Execution time for long term simulations on smaller projects was speeded up considerably by only refreshing the progress meter every day rather than every minute. 3. The time to draw time series graphs and perform statistical analyses on large data sets was considerably shortened. ----------------------- Build 5.0.002 (11/1/04) ----------------------- Engine Updates 1. Modifications made to the Picard method used for dynamic wave flow routing routine. ------------------------ Build 5.0.001 (10/29/04) ------------------------ First official release of SWMM 5.
Reblog this post [with Zemanta]
Read more…

President Obama's Inaugural Address

Hail to the Chief. President Barack Obama. My fellow citizens: I stand here today humbled by the task before us, grateful for the trust you have bestowed, mindful of the sacrifices borne by our ancestors. I thank President Bush for his service to our nation, as well as the generosity and cooperation he has shown throughout this transition. Forty-four Americans have now taken the presidential oath. The words have been spoken during rising tides of prosperity and the still waters of peace. Yet, every so often the oath is taken amidst gathering clouds and raging storms. At these moments, America has carried on not simply because of the skill or vision of those in high office, but because We the People have remained faithful to the ideals of our forbearers, and true to our founding documents. So it has been. So it must be with this generation of Americans. That we are in the midst of crisis is now well understood. Our nation is at war, against a far-reaching network of violence and hatred. Our economy is badly weakened, a consequence of greed and irresponsibility on the part of some, but also our collective failure to make hard choices and prepare the nation for a new age. Homes have been lost; jobs shed; businesses shuttered. Our health care is too costly; our schools fail too many; and each day brings further evidence that the ways we use energy strengthen our adversaries and threaten our planet. These are the indicators of crisis, subject to data and statistics. Less measurable but no less profound is a sapping of confidence across our land - a nagging fear that America's decline is inevitable, and that the next generation must lower its sights. Today I say to you that the challenges we face are real. They are serious and they are many. They will not be met easily or in a short span of time. But know this, America - they will be met. On this day, we gather because we have chosen hope over fear, unity of purpose over conflict and discord. On this day, we come to proclaim an end to the petty grievances and false promises, the recriminations and worn out dogmas, that for far too long have strangled our politics. We remain a young nation, but in the words of Scripture, the time has come to set aside childish things. The time has come to reaffirm our enduring spirit; to choose our better history; to carry forward that precious gift, that noble idea, passed on from generation to generation: the God-given promise that all are equal, all are free, and all deserve a chance to pursue their full measure of happiness. In reaffirming the greatness of our nation, we understand that greatness is never a given. It must be earned. Our journey has never been one of short-cuts or settling for less. It has not been the path for the faint-hearted - for those who prefer leisure over work, or seek only the pleasures of riches and fame. Rather, it has been the risk-takers, the doers, the makers of things - some celebrated but more often men and women obscure in their labor, who have carried us up the long, rugged path towards prosperity and freedom. For us, they packed up their few worldly possessions and traveled across oceans in search of a new life. For us, they toiled in sweatshops and settled the West; endured the lash of the whip and plowed the hard earth. For us, they fought and died, in places like Concord and Gettysburg; Normandy and Khe Sahn. Time and again these men and women struggled and sacrificed and worked till their hands were raw so that we might live a better life. They saw America as bigger than the sum of our individual ambitions; greater than all the differences of birth or wealth or faction. This is the journey we continue today. We remain the most prosperous, powerful nation on Earth. Our workers are no less productive than when this crisis began. Our minds are no less inventive, our goods and services no less needed than they were last week or last month or last year. Our capacity remains undiminished. But our time of standing pat, of protecting narrow interests and putting off unpleasant decisions - that time has surely passed. Starting today, we must pick ourselves up, dust ourselves off, and begin again the work of remaking America. For everywhere we look, there is work to be done. The state of the economy calls for action, bold and swift, and we will act - not only to create new jobs, but to lay a new foundation for growth. We will build the roads and bridges, the electric grids and digital lines that feed our commerce and bind us together. We will restore science to its rightful place, and wield technology's wonders to raise health care's quality and lower its cost. We will harness the sun and the winds and the soil to fuel our cars and run our factories. And we will transform our schools and colleges and universities to meet the demands of a new age. All this we can do. And all this we will do. Now, there are some who question the scale of our ambitions - who suggest that our system cannot tolerate too many big plans. Their memories are short. For they have forgotten what this country has already done; what free men and women can achieve when imagination is joined to common purpose, and necessity to courage. What the cynics fail to understand is that the ground has shifted beneath them - that the stale political arguments that have consumed us for so long no longer apply. The question we ask today is not whether our government is too big or too small, but whether it works - whether it helps families find jobs at a decent wage, care they can afford, a retirement that is dignified. Where the answer is yes, we intend to move forward. Where the answer is no, programs will end. And those of us who manage the public's dollars will be held to account - to spend wisely, reform bad habits, and do our business in the light of day - because only then can we restore the vital trust between a people and their government. Nor is the question before us whether the market is a force for good or ill. Its power to generate wealth and expand freedom is unmatched, but this crisis has reminded us that without a watchful eye, the market can spin out of control - and that a nation cannot prosper long when it favors only the prosperous. The success of our economy has always depended not just on the size of our Gross Domestic Product, but on the reach of our prosperity; on our ability to extend opportunity to every willing heart - not out of charity, but because it is the surest route to our common good. As for our common defense, we reject as false the choice between our safety and our ideals. Our Founding Fathers, faced with perils we can scarcely imagine, drafted a charter to assure the rule of law and the rights of man, a charter expanded by the blood of generations. Those ideals still light the world, and we will not give them up for expedience's sake. And so to all other peoples and governments who are watching today, from the grandest capitals to the small village where my father was born: know that America is a friend of each nation and every man, woman, and child who seeks a future of peace and dignity, and that we are ready to lead once more. Recall that earlier generations faced down fascism and communism not just with missiles and tanks, but with sturdy alliances and enduring convictions. They understood that our power alone cannot protect us, nor does it entitle us to do as we please. Instead, they knew that our power grows through its prudent use; our security emanates from the justness of our cause, the force of our example, the tempering qualities of humility and restraint. We are the keepers of this legacy. Guided by these principles once more, we can meet those new threats that demand even greater effort - even greater cooperation and understanding between nations. We will begin to responsibly leave Iraq to its people, and forge a hard-earned peace in Afghanistan. With old friends and former foes, we will work tirelessly to lessen the nuclear threat, and roll back the specter of a warming planet. We will not apologize for our way of life, nor will we waver in its defense, and for those who seek to advance their aims by inducing terror and slaughtering innocents, we say to you now that our spirit is stronger and cannot be broken; you cannot outlast us, and we will defeat you. For we know that our patchwork heritage is a strength, not a weakness. We are a nation of Christians and Muslims, Jews and Hindus - and non-believers. We are shaped by every language and culture, drawn from every end of this Earth; and because we have tasted the bitter swill of civil war and segregation, and emerged from that dark chapter stronger and more united, we cannot help but believe that the old hatreds shall someday pass; that the lines of tribe shall soon dissolve; that as the world grows smaller, our common humanity shall reveal itself; and that America must play its role in ushering in a new era of peace. To the Muslim world, we seek a new way forward, based on mutual interest and mutual respect. To those leaders around the globe who seek to sow conflict, or blame their society's ills on the West - know that your people will judge you on what you can build, not what you destroy. To those who cling to power through corruption and deceit and the silencing of dissent, know that you are on the wrong side of history; but that we will extend a hand if you are willing to unclench your fist. To the people of poor nations, we pledge to work alongside you to make your farms flourish and let clean waters flow; to nourish starved bodies and feed hungry minds. And to those nations like ours that enjoy relative plenty, we say we can no longer afford indifference to suffering outside our borders; nor can we consume the world's resources without regard to effect. For the world has changed, and we must change with it. As we consider the road that unfolds before us, we remember with humble gratitude those brave Americans who, at this very hour, patrol far-off deserts and distant mountains. They have something to tell us today, just as the fallen heroes who lie in Arlington whisper through the ages. We honor them not only because they are guardians of our liberty, but because they embody the spirit of service; a willingness to find meaning in something greater than themselves. And yet, at this moment - a moment that will define a generation - it is precisely this spirit that must inhabit us all. For as much as government can do and must do, it is ultimately the faith and determination of the American people upon which this nation relies. It is the kindness to take in a stranger when the levees break, the selflessness of workers who would rather cut their hours than see a friend lose their job which sees us through our darkest hours. It is the firefighter's courage to storm a stairway filled with smoke, but also a parent's willingness to nurture a child, that finally decides our fate. Our challenges may be new. The instruments with which we meet them may be new. But those values upon which our success depends - hard work and honesty, courage and fair play, tolerance and curiosity, loyalty and patriotism - these things are old. These things are true. They have been the quiet force of progress throughout our history. What is demanded then is a return to these truths. What is required of us now is a new era of responsibility - a recognition, on the part of every American, that we have duties to ourselves, our nation, and the world, duties that we do not grudgingly accept but rather seize gladly, firm in the knowledge that there is nothing so satisfying to the spirit, so defining of our character, than giving our all to a difficult task. This is the price and the promise of citizenship. This is the source of our confidence - the knowledge that God calls on us to shape an uncertain destiny. This is the meaning of our liberty and our creed - why men and women and children of every race and every faith can join in celebration across this magnificent mall, and why a man whose father less than sixty years ago might not have been served at a local restaurant can now stand before you to take a most sacred oath. So let us mark this day with remembrance, of who we are and how far we have traveled. In the year of America's birth, in the coldest of months, a small band of patriots huddled by dying campfires on the shores of an icy river. The capital was abandoned. The enemy was advancing. The snow was stained with blood. At a moment when the outcome of our revolution was most in doubt, the father of our nation ordered these words be read to the people: "Let it be told to the future world...that in the depth of winter, when nothing but hope and virtue could survive...that the city and the country, alarmed at one common danger, came forth to meet [it]." America. In the face of our common dangers, in this winter of our hardship, let us remember these timeless words. With hope and virtue, let us brave once more the icy currents, and endure what storms may come. Let it be said by our children's children that when we were tested we refused to let this journey end, that we did not turn back nor did we falter; and with eyes fixed on the horizon and God's grace upon us, we carried forth that great gift of freedom and delivered it safely to future generations.
Read more…

Learning Makes Itself Invisible

Learning Makes Itself Invisible
| Permalink

This is the first in a series of guest posts from Tom Stafford, co-author of Mind Hacks and School of Everything's psychologist-in-residence.

Once you have learnt something you see the world differently. Not only can you appreciate or do something that you couldn't appreciate or do before, but the way you saw the world before is now lost to you. This works for the small things as well as the big picture. If you learn the meaning of a new word, you won't be able to ignore it like you did previously. If you learn how to make a cup of out of clay you won't ever be able to see cups like you used to before.

This means it is hard to imagine what it is like for someone else who hasn't learnt what you've learnt. The psychologist Paul Bloom calls this the curse of knowledge in the context of being unable to model what other people don't know, rather than on what you yourself used not to know. If you've ever organised a surprise party for someone, or had another kind of secret, you'll know the feeling. It seems so *obvious* what you are keeping hidden, but usually the person you are hiding it from doesn't catch on. They don't catch on because the clues are only obvious to you, knowing the secret, and you find it hard to imagine what they see not knowing it.

The reason this occurs is because of two facts about the mind that are not widely appreciated. The first is that memory is not kept in a separate store away from the rest of the mind's functions. Although there are brain regions crucial to memory, the memories themselves are not stored separately from the regions which do perception, processing and output. Unlike a digital computer, your mind does not have to fetch stored information when it needs it, instead your memories affect every part of your perception and behaviour.

The second important fact about the mind is related to the first. It is that learning something involves changing the structures of the mind that are involved in perception and behaviour. Memories are not kept in a separate store, but are constituted by the connections between the neurons in your brain. This means that when you learn something --- when you create new memories --- it isn't just *added* to your mind, but it changes the structures that make up your mind so that your perceptions, behaviour and potentially all of your previous memories are changed too.

We can see this in microcosm if we look at a small example of what is called one-shot perceptual learning. What do you think this is?

Now probably you don't know, but I would like you do savour the feeling of not knowing. Try and taste, like a rare wine, what the perceptual experience is like. You can see the parts of the picture, the blacks and the whites, various shapes, some connected to others and some isolated.

If you now look at this popup here then you will have this taste washed out of your mind and irrevocably removed. It will be gone, and you will never be able to recover it. This is why I asked you to savour it. Now look at the original again. Notice how the parts are now joined in a whole. You just cannot see the splotches of black and white, the groups, the isolated parts, again. When you learn the meaning of the whole picture this removed the potential for that experience. Even the memory is tantalisingly out of reach. You can't recover an experience that you yourself had two minutes ago!

One-shot learning is unusual. Most learning happens over a far longer time-scale, so it is even harder to keep a grip on what it was like to not know. All of us will have had the experience of a bad teacher who simply couldn't see why we had a problem - they simply couldn't see that we couldn't understand or do what was obvious or easy to them. A good teacher has to have the dual-mind of knowing something, but also being able to empathise with someone who doesn't know it, someone for whom what is obvious isn't obvious yet. It is because learning has this tendency to make itself invisible that teaching is such a difficult and noble tradition.

Link: A Mindhacks.com post in which I discuss a similar thing in the context of the role expectations play in our perception.

The reference I took the picture from: Rubin, N., Nakayama, K. and Shapley, R. (2002), The role of insight in perceptual learning: evidence from illusory contour perception. In: Perceptual Learning, Fahle, M. and Poggio, T. (Eds.), MIT Press.

Read more…

SWMM 5 Horton Infiltration

Horton's equation

Named after the same Robert E. Horton mentioned above, Horton's equation[2] is another viable option when measuring ground infiltration rates or volumes. It is an empirical formula that says that infiltration starts at a constant rate, f0, and is decreasing exponentially with time, t. After some time when the soil saturation level reaches a certain value, the rate of infiltration will level off to the rate fc.

ft = fc + (f0fc)e kt

Where

ft is the infiltration rate at time t;
f0 is the initial infiltration rate or maximum infiltration rate;
fc is the constant or equilibrium infiltration rate after the soil has been saturated or minimum infiltration rate;
k is the decay constant specific to the soil.

The other method of using Horton's equation is as below. It can be used to find the total volume of infiltration, F, after time t.

F_t = f_ct+{(f_0 - f_c)\over k}(1-e^{-kt})
Reblog this post [with Zemanta]
Read more…

Green Ampt Infiltration

Soil composition. Subscripts s, w, a stand for...

Image via Wikipedia

Green-Ampt

Named for two men; Green and Ampt. The Green-Ampt[1] method of infiltration estimation accounts for many variables that other methods, such as Darcy's law, do not. It is a function of the soil suction head, porosity, hydraulic conductivity and time.

\int_0^{F(t)} {1-\psi\,\Delta\theta\over F+\psi\,\Delta\theta}\, dF = \int_0^t K\,dt

where

ψ is wetting front soil suction head;
θ is water content;
K is Hydraulic conductivity;
F is the total volume already infiltrated.

Once integrated, one can easily choose to solve for either volume of infiltration or instantaneous infiltration rate:

F(t)=Kt+\psi \, \Delta\theta \ln \left[1+{F(t)\over \psi \, \Delta\theta}\right].

Using this model one can find the volume easily by solving for F(t). However the variable being solved for is in the equation itself so when solving for this one must set the variable in question to converge on zero, or another appropriate constant. A good first guess for F is Kt. The only note on using this formula is that one must assume that h0, the water head or the depth of ponded water above the surface, is negligible. Using the infiltration volume from this equation one may then substitute F into the corresponding infiltration rate equation below to find the instantaneous infiltration rate at the time, t, F was measured.

f(t)=K\left[{\psi \, \Delta\theta\over F(t)}+1\right].
1. Water Resources Engineering, 2005 Edition, John Wiley & Sons, Inc, 2005.
Reblog this post [with Zemanta]
Read more…

More Chip Cores Can Mean Slower Supercomputing, Simulation Shows ScienceDaily (Jan. 15, 2009) — The worldwide attempt to increase the speed of supercomputers merely by increasing the number of processor cores on individual chips unexpectedly worsens performance for many complex applications, Sandia simulations have found.

A Sandia team simulated key algorithms for deriving knowledge from large data sets. The simulations show a significant increase in speed going from two to four multicores, but an insignificant increase from four to eight multicores. Exceeding eight multicores causes a decrease in speed. Sixteen multicores perform barely as well as two, and after that, a steep decline is registered as more cores are added.

The problem is the lack of memory bandwidth as well as contention between processors over the memory bus available to each processor. (The memory bus is the set of wires used to carry memory addresses and data to and from the system RAM.)

Supermarket analogy

To use a supermarket analogy, if two clerks at the same checkout counter are processing your food instead of one, the checkout process should go faster. Or, you could be served by four clerks.

Or eight clerks. Or sixteen. And so on.

The problem is, if each clerk doesn't have access to the groceries, he or she doesn't necessarily help the process. Worse, the clerks may get in each other's way.

Similarly, it seems a no-brainer that if one core is fast, two would be faster, four still faster, and so on.

But the lack of immediate access to individualized memory caches — the "food" of each processor — slows the process down instead of speeding it up once the number of cores exceeds eight, according to a simulation of high-performance computers by Sandia's Richard Murphy, Arun Rodrigues and former student Megan Vance.

"To some extent, it is pointing out the obvious — many of our applications have been memory-bandwidth-limited even on a single core," says Rodrigues. "However, it is not an issue to which industry has a known solution, and the problem is often ignored."

"The difficulty is contention among modules," says James Peery, director of Sandia's Computations, Computers, Information and Mathematics Center. "The cores are all asking for memory through the same pipe. It's like having one, two, four, or eight people all talking to you at the same time, saying, 'I want this information.' Then they have to wait until the answer to their request comes back. This causes delays."

"The original AMD processors in Red Storm were chosen because they had better memory performance than other processors, including other Opteron processors, " says Ron Brightwell. "One of the main reasons that AMD processors are popular in high-performance computing is that they have an integrated memory controller that, until very recently, Intel processors didn't have."

Multicore technologies are considered a possible savior of Moore's Law, the prediction that the number of transistors that can be placed inexpensively on an integrated circuit will double approximately every two years.

"Multicore gives chip manufacturers something to do with the extra transistors successfully predicted by Moore's Law," Rodrigues says. "The bottleneck now is getting the data off the chip to or from memory or the network."

A more natural goal of researchers would be to increase the clock speed of single cores, since the vast majority of applications are designed for single-core performance on word processors, music, and video applications. But power consumption, increased heat, and basic laws of physics involving parasitic currents meant that designers were reaching their limit in improving chip speed for common silicon processes.

"The [chip design] community didn't go with multicores because they were without flaw," says Mike Heroux. "The community couldn't see a better approach. It was desperate. Presently we are seeing memory system designs that provide a dramatic improvement over what was available 12 months ago, but the fundamental problem still exists."

In the early days of supercomputing, Seymour Cray produced a superchip that processed information faster than any other chip. Then a movement — led in part by Sandia — proved that ordinary chips, programmed to work different parts of a problem at the same time, could solve complex problems faster than the most powerful superchip. Sandia's Paragon supercomputer, in fact, was the world's first parallel processing supercomputer.

Today, Sandia has a large investment in message-passing programs. Its Institute for Advanced Architectures, operated jointly with Oak Ridge National Laboratory (ORNL) and intended to prepare the way for exaflop computing, may help solve the multichip dilemma.

ORNL's Jaguar supercomputer, currently the world's fastest for scientific computing, is a Cray XT model based on technology developed by Sandia and Cray for Sandia's Red Storm supercomputer. Red Storm's original and unique design is the most copied of all supercomputer architectures.

The current work was funded by Sandia's Laboratory-Directed Research and Development office.


Adapted from materials provided by DOE/Sandia National Laboratories.
Email or share this story:
The multicore dilemma: more cores on a single chip don't necessarily mean faster clock speeds, a Sandia simulation has determined. (Credit: Photo by Randy Montoya)

Reblog this post [with Zemanta]
Read more…

Dark green

Dark green A scientist argues that the natural world isn't benevolent and sustaining: it's bent on self-destruction By Drake Bennett January 11, 2009 WHEN WE LOOK at nature, it has become commonplace to see a fastidiously self-regulating system at work: wildebeest trim the savannah grasses, lions cull the wildebeest herds, and vultures clean the bones of both. Forests take in the carbon dioxide we exhale, use it to grow, and replace it with oxygen. The planet even has a thermostat, the carbon cycle, which relies on the interplay of volcanoes, rain, sunlight, plants, and plankton to keep the earth's temperature in a range congenial to life. This idea of nature's harmonious balance has become not just the bedrock of environmental thought, but a driving force in policy and culture. It is the sentiment behind Henry David Thoreau's dictum, "In wildness is the preservation of the world." It lies behind last summer's animated blockbuster "Wall-E," in which a single surviving plant helps revive an earth smothered beneath the detritus of human overconsumption. It underlies environmental laws that try to minimize the damaging influence of humans on land and the atmosphere. In this line of thought, the workings of the natural world, honed over billions of years of evolution, have reached a dynamic equilibrium far more elegant - and ultimately durable - than the clumsy attempts humankind makes to alter or improve them. According to the paleontologist Peter Ward, however, nothing could be further from the truth. In his view, the earth's history makes clear that, left to run its course, life isn't naturally nourishing - it's poisonous. Rather than a supple system of checks and balances, he argues, the natural world is a doomsday device careening from one cataclysm to another. Long before humans came onto the scene, primitive life forms were busily trashing the planet, and on multiple occasions, Ward argues, they came close to rendering it lifeless. Around 3.7 billion years ago, they created a planet-girdling methane smog that threatened to extinguish every living thing; a little over a billion years later they pumped the atmosphere full of poison gas. (That gas, ironically, was oxygen, which later life forms adapted to use as fuel.) The story of life on earth, in Ward's reckoning, is a long series of suicide attempts. Four of the five major mass extinctions since the rise of animals, Ward says, were caused not by meteor impacts or volcanic eruptions, but by bacteria, and twice, he argues, the planet was transformed into a nearly total ball of ice thanks to the voracious appetites of plants. In other words, it's not just human beings, with our chemical spills, nuclear arsenals, and tailpipe emissions, who are a menace. The main threat to life is life itself. "Life is toxic," Ward says. "It's life that's causing all the damn problems." Ward holds the Gaia Hypothesis, and the thinking behind it, responsible for encouraging a set of fairy-tale assumptions about the earth, and he'd like his new book, due out this spring, to help puncture them. He hopes not only to shake the philosophical underpinnings of environmentalism, but to reshape our understanding of our relationship with nature, and of life's ultimate sustainability on this planet and beyond. (Brian Stauffer for The Boston Globe) Although Ward's ideas have yet to reach a broad audience, some scientists are welcoming his portrait of a constantly off-kilter earth as a corrective to the gauzier precepts that have cast their spells on environmental philosophy and policy. Others, however, describe his hypothesis as simply Gaia's dark twin, a model undermined by the same inclination to see one tendency as the whole story. Ward is open to the criticism that he's taken things too far; what's important, he believes, is weaning people from the idea that the earth works better without us. Even if Medea is an incomplete framework for viewing the natural world, it introduces a hardheadedness into environmental debates often driven by an unexamined idealism about Mother Nature. Ward himself believes that the only help for the planet over the long run is management by human beings - whether that means actively adjusting the chemical composition of the atmosphere or using giant satellites to modify the amount of sunlight that reaches us. As Ward sees it, the planet doesn't need our help destroying itself. It will do that automatically. It needs us to save it. For most of human history, it would have been alien to think of the planet as a "system" at all - the earth seemed an essentially infinite expanse of lands and seas that, depending on your theology, awaited human cultivation or demanded human deference. But with the Industrial Revolution it started to become clear that humans themselves were making changes with far-reaching, unintended, and destructive consequences, and over the 20th century an alternative understanding of the natural world began to take hold. This view saw the earth as a closed system with an inherent natural order, and pointed out the ways it broke down when we stressed it by pumping chemicals into the air or killing off animals that were vital links in food chains. By the late 1970s, when the British scientist James Lovelock proposed the Gaia Hypothesis, something that once might have seemed like science fiction - the notion that all living things on the planet were linked like the cells in a single body - seemed like a persuasive model. Lovelock was a serious scientist - a creation of his, the electron capture detector, was to prove instrumental in revealing the depletion of the ozone layer - and he had plenty of evidence for his theory. He pointed to the fact that, despite the wide variability of the sun's heat over the eons, microbes and plants have altered both the atmosphere and the ground to keep the temperature almost entirely within the narrow range in which terrestrial life thrives. For nearly as long, the amount of oxygen that plants and geological processes released into the atmosphere has remained at a point high enough to feed the metabolisms of quintillions of animals, but not so high that every forest was constantly going up in flames.Continued... More.... "The longevity of the biosphere can only be sustained through large-scale geoengineering," Ward argues. Without our firm hand, he believes, "the earth will go to hell in a handbasket," just as it has again and again in the past.
Read more…

SWMM 5 Variable Time Step

Topic: The Variable time step and the Adjustment Factor. The adjustment factor lowers the internal time step used in the model. In the example model the lowering of the Adjustment factor from 75 percent to 25 percent lowers the minimum simulation time step from 20 second to 3 seconds. The inflow and outflow of the model stays the same, what changes is the computed internal time step based on the Courant CFL condition.

At each time step the minimum CFL time step is calculated based on the length of the link (delta x), the ending velocity at the last time step in the link (V) and the ending link depth at the last time step (D).


Read more…
A schematic representation of the exchanges of...

Image via Wikipedia

Sun's Magnetic Field May Impact Weather And Climate: Sun Cycle Can Predict Rainfall Fluctuations ScienceDaily (Dec. 3, 2008) — The sun’s magnetic field may have a significant impact on weather and climatic parameters in Australia and other countries in the northern and southern hemispheres. According to a study in Geographical Research, the droughts are related to the solar magnetic phases and not the greenhouse effect. The study uses data from 1876 to the present to examine the correlation between solar cycles and the extreme rainfall in Australia. It finds that the Southern Oscillation Index (SOI) – the basic tool for forecasting variations in global and oceanic patterns – and rainfall fluctuations recorded over the last decade are similar to those in 1914 -1924. Author Professor Robert G. V. Baker from the School of Environmental Studies, University of New England, Australia, says, “The interaction between the directionality in the Sun’s and Earth’s magnetic fields, the incidence of ultraviolet radiation over the tropical Pacific, and changes in sea surface temperatures with cloud cover – could all contribute to an explanation of substantial changes in the SOI from solar cycle fluctuations. If solar cycles continue to show relational values to climate patterns, there is the potential for more accurate forecasting through to 2010 and possibly beyond.” The SOI-solar association has been investigated recently due to increasing interest in the relationship between the sun’s cycles and the climate. The solar application offers the potential for the long-range prediction of SOI behavior and associated rainfall variations, since quasi-periodicity in solar activity results in an expected cycle of situations and phases that are not random events. Professor Baker adds, “This discovery could substantially advance forecasting from months to decades. It should result in much better long-term management of agricultural production and water resources, in areas where rainfall is correlated to SOI and El Niño (ENSO) events.” Journal reference: Baker et al. Exploratory Analysis of Similarities in Solar Cycle Magnetic Phases with Southern Oscillation Index Fluctuations in Eastern Australia. Geographical Research, 2008; 46 (4): 380 DOI: 10.1111/j.1745-5871.2008.00537.x Adapted from materials provided by Wiley - Blackwell. Wiley - Blackwell (2008, December 3). Sun's Magnetic Field May Impact Weather And Climate: Sun Cycle Can Predict Rainfall Fluctuations. ScienceDaily. Retrieved January 11, 2009, from http://www.sciencedaily.com /releases/2008/12/081202081449.htm
Reblog this post [with Zemanta]
Read more…

Floods To Become Commonplace By 2080

ScienceDaily (Jan. 9, 2009) — Flooding like that which devastated the North of England last year is set to become a common event across the UK in the next 75 years, new research has shown.

A study by Dr Hayley Fowler, of Newcastle University, predicts that severe storms – the likes of which currently occur every five to 25 years across the UK – will become more common and more severe in a matter of decades.

Looking at ‘extreme rainfall events’ – where rain falls steadily and heavily for between one and five days – the study predicts how the intensity of these storms may change in the future.

Dr Fowler found that across the UK, the amount of rain falling during one of these extreme events was likely to increase by up to 30 per cent by 2080. This increase is most likely to occur in autumn, winter and spring when the ground is already saturated, posing the biggest threat of flooding.

Dr Fowler, Reader in Climate Change Impacts at Newcastle, explained: “Predicting how extreme rainfall might change many years in the future is very difficult because events can be quite localised, especially in the summer.

“You only have to think about how difficult it is for the Met office to predict the weather two or three days in advance – the overall picture for the country tends to stay the same but local weather patterns can change quite dramatically.

“By taking a much more detailed look at the results from different regional climate models, we have created a more accurate picture of how wet Britain will be by 2070.

“What the data quite clearly shows is that we’re going to see far more of these extreme downpours in years to come, putting more and more homes at risk from flooding, particularly in autumn and winter months when the ground is already saturated.”

The research, published online today in the International Journal of Climatology, looks at changes to seasonal extreme rainfall across the UK by 2070-2100.

Dr Fowler, who worked on the study with Dr Marie Ekstrom from Exeter University, examined seasonal rainfall data from 13 Regional Climate Models for nine regions across the UK and used this to study the projected changes.

Consistent with global warming, the team found that as the air becomes warmer and is able to hold more moisture, Britain will get wetter.

In general, the study suggests larger changes to the intensity of short duration extreme rainfall events – those lasting one or two days. Northern and western regions of the UK are predicted to be worst hit.

Dr Fowler added: “Unfortunately, we still have least confidence in the model’s predictions for the summer months and it is still highly uncertain how summer flash flooding such as the Hull and Hereford and Worcester floods in 2007 will change.

“What our data does show is that floods are no longer going to be freak events. All 13 models we looked at predict increases in extreme rainfall in winter, autumn and spring by the 2080s although the percent increase varies.

“This has major implications for flood risk management. We need to be looking now at where we build new homes, drainage systems and water storage in order to protect our homes and businesses from flooding in the future.”

Episodes of short-term extreme rainfall – such as was seen in Morpeth in 2008 – are predicted to increase in intensity by between 15 and 30 per cent.

In winter, one day downpours are predicted to increase in intensity in all regions with Scotland and northern England seeing changes of more than 20 per cent. Smaller increases are projected for southern regions, particularly south-east England.

In autumn, some regional climate models project potentially very large increases in extreme rainfall, with a rise of up to 60 per cent in some regions such as north-west England.


Adapted from materials provided by Newcastle University.
Email or share this story:

Reblog this post [with Zemanta]
Read more…

How Did Life Begin? RNA That Replicates Itself Indefinitely Developed

For First Time

ScienceDaily (Jan. 10, 2009) — One of the most enduring questions is how life could have begun on Earth. Molecules that can make copies of themselves are thought to be crucial to understanding this process as they provide the basis for heritability, a critical characteristic of living systems. New findings could inform biochemical questions about how life began.


Now, a pair of Scripps Research Institute scientists has taken a significant step toward answering that question. The scientists have synthesized for the first time RNA enzymes that can replicate themselves without the help of any proteins or other cellular components, and the process proceeds indefinitely.

The work was recently published in the journal Science.

In the modern world, DNA carries the genetic sequence for advanced organisms, while RNA is dependent on DNA for performing its roles such as building proteins. But one prominent theory about the origins of life, called the RNA World model, postulates that because RNA can function as both a gene and an enzyme, RNA might have come before DNA and protein and acted as the ancestral molecule of life. However, the process of copying a genetic molecule, which is considered a basic qualification for life, appears to be exceedingly complex, involving many proteins and other cellular components.

For years, researchers have wondered whether there might be some simpler way to copy RNA, brought about by the RNA itself. Some tentative steps along this road had previously been taken by the Joyce lab and others, but no one could demonstrate that RNA replication could be self-propagating, that is, result in new copies of RNA that also could copy themselves.

In Vitro Evolution

A few years after Tracey Lincoln arrived at Scripps Research from Jamaica to pursue her Ph.D., she began exploring the RNA-only replication concept along with her advisor, Professor Gerald Joyce, M.D., Ph.D., who is also Dean of the Faculty at Scripps Research. Their work began with a method of forced adaptation known as in vitro evolution. The goal was to take one of the RNA enzymes already developed in the lab that could perform the basic chemistry of replication, and improve it to the point that it could drive efficient, perpetual self-replication.

Lincoln synthesized in the laboratory a large population of variants of the RNA enzyme that would be challenged to do the job, and carried out a test-tube evolution procedure to obtain those variants that were most adept at joining together pieces of RNA.

Ultimately, this process enabled the team to isolate an evolved version of the original enzyme that is a very efficient replicator, something that many research groups, including Joyce's, had struggled for years to obtain. The improved enzyme fulfilled the primary goal of being able to undergo perpetual replication. "It kind of blew me away," says Lincoln.

Immortalizing Molecular Information

The replicating system actually involves two enzymes, each composed of two subunits and each functioning as a catalyst that assembles the other. The replication process is cyclic, in that the first enzyme binds the two subunits that comprise the second enzyme and joins them to make a new copy of the second enzyme; while the second enzyme similarly binds and joins the two subunits that comprise the first enzyme. In this way the two enzymes assemble each other — what is termed cross-replication. To make the process proceed indefinitely requires only a small starting amount of the two enzymes and a steady supply of the subunits.

"This is the only case outside biology where molecular information has been immortalized," says Joyce.

Not content to stop there, the researchers generated a variety of enzyme pairs with similar capabilities. They mixed 12 different cross-replicating pairs, together with all of their constituent subunits, and allowed them to compete in a molecular test of survival of the fittest. Most of the time the replicating enzymes would breed true, but on occasion an enzyme would make a mistake by binding one of the subunits from one of the other replicating enzymes. When such "mutations" occurred, the resulting recombinant enzymes also were capable of sustained replication, with the most fit replicators growing in number to dominate the mixture. "To me that's actually the biggest result," says Joyce.

The research shows that the system can sustain molecular information, a form of heritability, and give rise to variations of itself in a way akin to Darwinian evolution. So, says Lincoln, "What we have is non-living, but we've been able to show that it has some life-like properties, and that was extremely interesting."

Knocking on the Door of Life

The group is pursuing potential applications of their discovery in the field of molecular diagnostics, but that work is tied to a research paper currently in review, so the researchers can't yet discuss it.

But the main value of the work, according to Joyce, is at the basic research level. "What we've found could be relevant to how life begins, at that key moment when Darwinian evolution starts." He is quick to point out that, while the self-replicating RNA enzyme systems share certain characteristics of life, they are not themselves a form of life.

The historical origin of life can never be recreated precisely, so without a reliable time machine, one must instead address the related question of whether life could ever be created in a laboratory. This could, of course, shed light on what the beginning of life might have looked like, at least in outline. "We're not trying to play back the tape," says Lincoln of their work, "but it might tell us how you go about starting the process of understanding the emergence of life in the lab."

Joyce says that only when a system is developed in the lab that has the capability of evolving novel functions on its own can it be properly called life. "We're knocking on that door," he says, "But of course we haven't achieved that."

The subunits in the enzymes the team constructed each contain many nucleotides, so they are relatively complex and not something that would have been found floating in the primordial ooze. But, while the building blocks likely would have been simpler, the work does finally show that a simpler form of RNA-based life is at least possible, which should drive further research to explore the RNA World theory of life's origins.


Journal reference:

  1. Lincoln et al. Self-Sustained Replication of an RNA Enzyme. Science, Jan 8, 2009; DOI:10.1126/science.1167856
Adapted from materials provided by Scripps Research Institute.
Email or share this story:

Reblog this post [with Zemanta]
Read more…

Forecasting Rain: Radars For Estimating Rainfall Rates

ScienceDaily (Nov. 17, 2008) — To be effective, flood warning systems use rainfall data available in real time. These data come from the ground observation network and estimations made based on the national network of climate radars operated by Météo France.Today, mountain zones are only partially covered by this rain detection technology. Within the INTERREG project, a new generation of radars is being tested by Cemagref in the Var department, a mountainous region with a high flood risk. The radar is currently located in the countryside immediately inland from Nice.

Measuring the intensity of rain as it is falling is indispensable to anticipating rapidly rising waters and reacting to the associated flood risk. To the classical rain gauges installed throughout the area, new radar technologies were added in the 1990s to detect rain and measure the accumulation of precipitations in real time.

Today, Météo France has a national network of 24 weather radars available within approximately 100 km. However, all regions in France are not covered by this mesh, in particular the mountain zones where the relief masks downstream rain zones by creating an obstacle to wave displacement. Within the FRAMEA project, a new radar technology developed by Novimet is being tested at the Aix-en-Provence Cemagref. The experiments conducted in the Maures massive have proven to be highly promising.

More compact and less expensive radars

The radars used at the beginning to monitor planes flying overhead were extended to the detection and quantification of precipitations. Large-scale radars, 6–8 m in antenna diameter, are used today in weather stations located in the plains. In mountain zones, the number of radars must be multiplied in relation to the relief, which requires smaller and less expensive models. The new Hydrix radar responds to these demands. However, by reducing the diameter of the parabolic antenna to 1.5 m, the wave frequency must be boosted, which increases the attenuation of waves during their displacement.

To compensate this signal attenuation effect, a profiling algorithm (ZPHI) is used. Finally, the radar operates in double polarization, which provides information on the size of the rain drops and estimates precipitations without resetting ground network observations. Today, in a doctoral dissertation supervised by both Cemagref and the firm Novimet, this new radar technology is being tested in the Var department, a mountainous region that experiences very intense flash floods.

Results that are coherent with ground readings

The Hydrix is installed near Réal Collobrier, Cemagre’s instrumented research catchment, located in the Maures massif. The total rainfall in autumn 2006 calculated by the radar was compared to the rain gauge readings on the ground and to the accumulation estimated by one of the nearby radars belonging to the Météo France network. Within a 60- to 80-km radius, the data supplied by the radar were in coherence with the quantities of rain collected on the ground. In addition, the algorithmic signal processing retransmitted rain gauge data in real time that were as good quality as the data sent by the classical radar managed by Météo France. Today, the research is continuing so as to integrate the rain gauge data supplied by the radar into existing rainfall-runoff models.

By converting rainfall into runoff, these mathematical tools can calculate the runoff of rivers at the outlet of a catchment. These rainfall and runoff data then feed the flood warning systems, such as the Aiga system developed by Cemagref and Météo France in 2005. By completing the existing radar network, the Hydrix technology will contribute to the extension of the flood warning system over the entire area, including mountainous zones.


Adapted from materials provided by Cemagref.
Email or share this story:

Reblog this post [with Zemanta]
Read more…