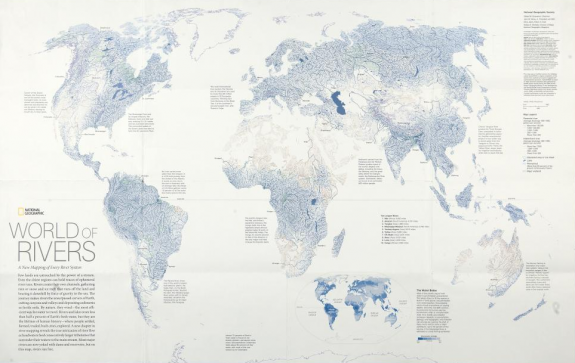
Every river system mapped in World of Rivers

The annual Malofiej awards, for top graphics in journalism, were handed out last week. The best map of 2010 went to National Geographic for the World of Rivers. Every river system in the world was mapped and scaled by annual discharge.
We live on a planet covered by water, but more than 97 percent is salty, and nearly 2 percent is locked up in snow and ice. That leaves less than one percent to grow our crops, cool our power plants, and supply drinking and bathing water for households.
Showing everything doesn't always work with so much data, but it does in this case. It reminds me of Ben Fry's All Streets. See the full-sized interactive version on National Geographic.
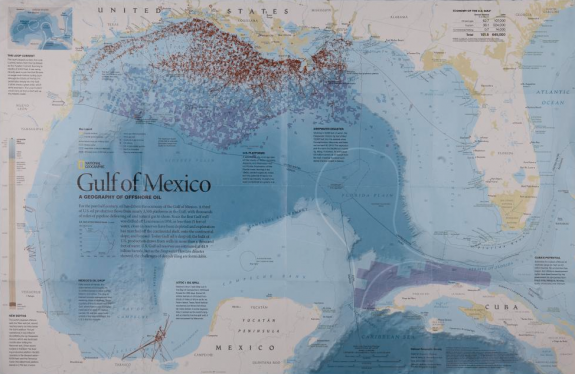
Also, congratulations to National Geographic for winning the Peter Sullivan award (best in show) for their map of the oil spill in the Gulf of Mexico and The New York Times for their work on how Mariano Rivera dominates, print and online, respectively.


Comments