All Posts (522)

Sort by

MWH Soft Unveils Highly Anticipated InfoWorks TS for Comprehensive Hydraulic Transient Analysis
of Water Distribution Systems

Fourth Quarter 2010 Release to Deliver Unprecedented Transient Modeling Capabilities for Better Decision-Making

Broomfield, Colorado USA, June 16, 2010 — MWH Soft, a leading global innovator of wet infrastructure modeling and simulation software and technologies, today announced the fourth quarter release of InfoWorks TSfor advanced hydraulic transient analysis. The groundbreaking release will give InfoWorks WS users worldwide direct access to the industry’s fastest, most comprehensive and widely acclaimed pressure surge analysis application, with unsurpassed power to help them better preserve distribution system integrity and avert potential problems. The news reflects MWH Soft’s vanguard position in the water industry and its continuing commitment to delivering pioneering technology for enhancing the safety and reliability of the world’s water supply.


Anticipating and controlling transient response is critical to ensuring the protection, integrity, and effective/efficient operation of water distribution systems. Transient responses can introduce pressures of sufficient magnitude (upsurge) to burst pipes and damage equipment. The resulting repercussions can include extended service outages and loss of property and life. Transient responses can also produce sub-atmospheric pressures (downsurge) that can force contaminated groundwater into the distribution system at a leaky joint, crack or break, leading to grave health consequences. Sustained sub-atmospheric pressures may also lead to cavitation and water column separation, resulting in severe “water hammer” effects as the vapor cavity collapses.

The state-of-the-art, full-featured InfoWorks TS transient flow analysis solution will address every facet of pressure surge analysis and its role in utility infrastructure management and protection, delivering the highest rate of return in the industry. It will provide the engineer-friendly framework needed to quickly assess the effects of pump station power failures, pump startup, valve closures, rapid demand and pump speed changes, and the efficacy of any combination of surge protection devices. The program will also accurately simulate transient cavitation and water column separation, evaluate their intensity, and estimate their potential effects on the system.


Armed with this information, water utilities can more accurately predict the development of unacceptable operating conditions in their distribution systems, identify vulnerable areas and risks, evaluate and design sound protective measures, and determine improved operational plans and security upgrades. InfoWorks TS will also deliver blazing simulation speed, making transient analysis an even easier and more enjoyable task.


“Water utilities and engineering consulting firms around the world rely on MWH Soft’s superior end-to-end modeling and design solutions to manage and operate better, safer systems,” said Paul F. Boulos, Ph.D, Hon.D.WRE, F.ASCE, President and Chief Operating Officer of MWH Soft. “By augmenting our popularInfoWork WS with powerful hydraulic transient modeling capabilities, we are creating a comprehensive tool kit for the waterworks engineer. This milestone solution will be the only analysis, design and management software users need to work faster and smarter in a competitive environment — not only to power system performance, but to safeguard critical infrastructures and maximize their effectiveness in protecting public health.”

Read more…

The “Hockey Stick” evolution

The “Hockey Stick” evolution

By andyrussell

This is a post that aims to go through the evolution of the “Hockey Stick” from 1990 to the present day. It naturally misses out parts of the story, which deserve far more analysis, simply to keep the post short. Comments that expand on the bits I’ve omitted are welcome!

What is the “Hockey Stick” and who cares?

One of the key areas of controversy relating to climate change and the body that synthesises all the science – the Intergovernmental Panel on Climate Change (IPCC) – is the so-called “Hockey Stick” graph that first appeared in the IPCC in 2001.

The graph is important because it tries to reconstruct large-scale temperatures for the past 1000 years or so to put the current warming in context.

Lots of people have spent many hours trying to assess or discredit the graph and the science behind it:

  • There have been several official (and controversial) inquires and reports on the science and the scientists. Two of the most well-known are the NRC Report and the Wegman Report.
  • The Climate Audit blog, and its many followers, have been picking at the science, the raw data and the method that produced the “Hockey Stick” for a long time.
  • The Bishop Hill blog has many posts on the “Hockey Stick” and the man behind that blog has even written a book about the graph(I’ve not read the book but I’d like to review it for this blog soon).

So if it’s so important, how did the “Hockey Stick” get here and where did it go? Let’s have a look…

IPCC First Assessment Report (FAR) – 1990

The temperature reconstruction of the last 1000 years or so in the FAR was little more than a best guess. The figure shown below from the report (you can find it on page 202 of the FAR (big pdf)) was even labelled as a “schematic” diagram and had no scale on the temperature axis:

It’s a composite overview of the evidence available in 1990 from ice cores, tree rings, historical records and other so-called “proxy” measures of temperature. This field of research was in its infancy so the schematic wasn’t highlighted much in the report.

Indeed, the reason for including this plot at all in the FAR is probably summed up by this quote:

“So it is important to recognise that natural variations of climate are appreciable and will modulate any future changes induced by man”

However, this plot is still referred to by a lot of people as the temperature at the “present day” end of the graph is not the highest value on the plot.

Given that it’s essentially a sketch, I’m surprised that people read much into this plot.

For example, the usually meticulous Science of Doom was, in my opinion, off the mark with his analysis of the development of the science here, skipping straight from the First to the Third Assessment Report version to imply that something underhand was going on. This doesn’t represent the scientific progress properly. So, we’ll look here at the parts of the story that SoD missed out.

[The SoD post also doesn't show the IPCC FAR version of the plot (he uses one from a 1993 textbook that has a temperature scale) and he points to the Wegman report as the point of reference for analysis of the "Hockey Stick", which is perhaps not the bestsource. Indeed, the Stoat blog has recently examined Wegman's analysis of this plot and the conclusions are not supportive.]

IPCC Second Assessment Report (SAR) – 1995

So where did the science go between the FAR and SAR?

It seems that it went backwards; the SAR reconstruction only goes back 600 years and not 1000 years like the FAR.

Here’s the relevant plot from page 175 of the IPCC SAR (another big pdf):

Why does it only go back 600 years? Well, here’s a quote from the SAR:

“Prior to 1400 data are insufficient to provide hemispheric temperature estimates.”

Ok, to be fair on the IPCC, there is now a temperature scale, which is a big improvement. Also, the IPCC has recognised what they do not know enough about the climate prior to 1400 AD and removed that part of the plot. I suppose you could read this as the start of a conspiracy to “cover-up” the Medieval Warm Period but there is no evidence for that. [For example, here's a recent example of interpreting a decent paper poorly to reach the conclusion you want regarding the MWP.]

The report also says:

“A recent analysis, using tree-ring density data, has attempted to reproduce more of the century time-scale temperature variability in this region (Briffa et al, 1995). This shows that the 20th century was clearly the warmest in the last 1000 years in this region, though shorter warmer periods occurred, for example, in the 13th and 14th centuries.”

So the state of the art science in 1995 was not particularly clear but it does give an indication of where it was going…

IPCC Third Assessment Report (TAR) – 2001

Here’s where the story really takes off…

This plot is a composite of all the “best” proxy climate data available at the time of writing the TAR – you can find the plot and lots of background information here on pages 130-136 of the TAR.

It is most strongly linked to Michael Mann of Penn State Universityand it was this version that was dubbed the “Hockey Stick” (because it looks like an Ice Hockey Stick, I thought that was worth mentioning in case UK readers are wondering why it doesn’t curl around at the end!)

As hinted at in the SAR, there was a lot of new work looking at these reconstructions between the SAR and the TAR so it goes back further and includes regions of uncertainty.

But this was still quite new science. If it could be trusted then it would be an important addition to the TAR. [But it wouldn't be the only or most important part of the report and not a fundamental result that supports the rest of the science, that's not how science works. To steal an analogy, science is more like a jigsaw than a house of cards.]

The IPCC clearly came to the conclusion that this plot was trustworthy and delivered this verdict:

“Taking into account [the] substantial uncertainties, Mann et al. (1999) concluded that the 1990s were likely to have been the warmest decade, and 1998 the warmest year, of the past millennium for at least the Northern Hemisphere.”

This did not go down well with some people (and the language was toned down in the subsequent IPCC report).

The controversy is quite well documented, Wikipedia is as good a starting place as any. More recently, some of the discussion between the IPCC scientists that appeared in the incomplete email record that was taken from the University of East Anglia’s Climatic Research Unit in 2009 has further fueled this controversy. [The "hide the decline" email being the most obvious and relevant example, although this has been misinterpreted and blown out of all proportion - RealClimate give a good account of the context.]

The raw data, the methodology and the statistical tools used to produce the graph have all been examined in great depth. Everyone from bloggers to the US Senate have been interested in it. It must be one of the most intensely scrutinised graphs ever produced.

But it’s only a graph, so why all the fuss?

In my opinion, using relatively new science to advise policy makers on issues that affect the whole population’s way of life is bound to throw up problems, especially if you don’t like what the message is. But that was the situation that the IPCC was in and they were probably right to stress the importance of this graph – it was new science bit none of the investigations into it have landed a killer blow.

Indeed, maybe all the scrutiny would help the science develop faster and become more reliable.

So did it?

IPCC Fourth Assessment Report (AR4) – 2007

Here is the most recent IPCC “Hockey Stick”-type plot. Its background information can be found here in the AR4.

Despite all the attacks on the 2001 “Hockey Stick”, an improved version was included in the 2007 IPCC report. The report discussed the peer-reviewed criticisms of the methodology, which the IPCC deserve credit for.

Questions still remain over the statistical methods used in this graph and this does not make the discussion very accessible but here is a very quick attempt.

The main conclusion from several of the relevant inquiries was that the statistical methods were not ideal but they did not change the result (i.e. the shape of the graph) in any significant way. To give a specific example, Lord Oxburgh’s review of the science concluded that the climate scientists should collaborate more with statisticians. This point is hard to disagree with.

Some people, however, still believe that the statistical methods are a terminal issue for the “Hockey Stick”. Here’s Bishop Hill in 2008on the stats (from a very “sceptical” point of view). He also reported on a couple of papers that aimed to refute the major criticisms of the methods and their tortured journeys to get into the IPCC AR4 (although, having published in both GRL and CC myself, this story doesn’t sound as remarkable as Bishop Hill spins it!) And here’s a defence of the “Hockey Stick” methods fromRealClimate in 2005.

This argument is going to continue and the science will continue to improve.

The thing that strikes me as odd, though, is that most of the criticism aimed at the “Hockey Stick” is still aimed at the 2001 version. I suppose that there is more ammunition to attack this version with – the data was very new, the methods were new, it was high-profile and the CRU emails give new opportunities to quote mine. I get the feeling that some of the “sceptic” community have put nearly all their eggs in this basket and it therefore needs to continue to attack the 2001 version.

In the meantime, the science has moved on and improved. Indeed, the latest Mann et al. version of the work in PNAS has beenquestioned in the same journal and the response by Mann et al.showed some of those criticism to be quite strange.


IPCC Fifth Assessment Report (AR5) 2013

So what’s going to happen next?

I assume that the work of some of the key players may have been slowed a little because of all the inquiries they’ve had to deal with.

However, as the field has developed other groups will have taken on the challenge and there are now more groups than ever (with new ideas and perspectives) working on these issues. Indeed, the IPCC has increased the prominence of this type of work for their next report – the outline for AR5 includes a whole chapter (Chapter 5) on palaeoclimatology – it was a chapter sub-section in AR4 and TAR.

This is good news and hopefully we’re getting closer to truth, which is what the scientists wanted all along.

Reference:
ResearchBlogging.orgMann ME, Zhang Z, Hughes MK, Bradley RS, Miller SK, Rutherford S, & Ni F (2008). Proxy-based reconstructions of hemispheric and global surface temperature variations over the past two millennia. Proceedings of the National Academy of Sciences of the United States of America, 105 (36), 13252-7 PMID: 18765811

Read more…

Physics of oil spills

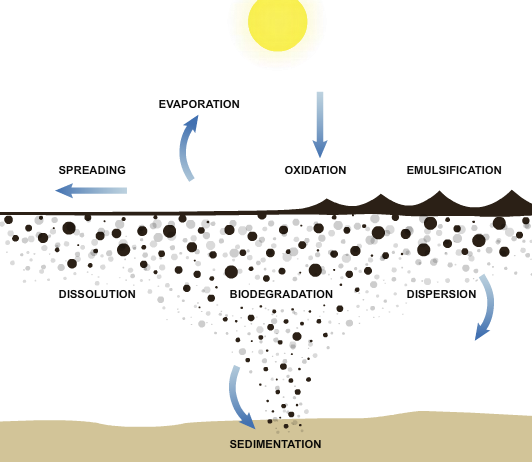
What exactly is going on with all the oil spewing into the Gulf, biologically speaking? MSNBC explains in a series of graphics:

The Deepwater Horizon oil spill has released millions of gallons of crude oil into the Gulf of Mexico, making it the most devastating oil spill in U.S. history. It is clear that the spilled oil will have a large impact on the Gulf coast for years to come, but what happens to the oil in the first hours, days and weeks as it interacts with the surrounding elements?

There are many physical and chemical processes, collectively known as weathering, that change the oil's properties and behavior after it is spilled into the ocean.

It begins with the oil particles spreading, and over months and years, particles eventually sink to the ocean floor and micro-organisms feed on hydrocarbons in the spilled oil. After that, I like to think everyone refuses to buy anything BP-related and the company goes bye-bye.

Are there any graphics that describe the impact on wildlife, other than the pictures of oil-covered birds that make you want to curl up into the fetal position and cry for Mother Nature?

[Thanks, Jonah]

Subscribe to the RSS feed or follow @flowingdata on Twitter to stay updated on what's new in data visualization and infographics. Because it's awesome.

Read more…

What the Gulf Disaster Could Tell Us About Sudden Global Warming

on June 11, 2010 2:00 PM | | 0 Comments

Could the gushing BP well help explain an ancient climate mystery?

Today, a crew of scientists are setting off for roughly 10 days to take measurements near the gushing well at the bottom of the Gulf of Mexico—but they're not looking for oil. Oceanographer John Kessler of Texas A&M University, College Station, and his colleagues have been awarded a grant by the National Science Foundation for a research cruise on the R/V Cape Hatteras, to measure concentrations of methane gas. Methane makes up about 40% by mass of what's spewing out of the well, according to measurements by BP.

The purpose of the cruise is twofold, Kessler says. How much oil has entered the gulf is the question on everyone's minds. (Oceanographer David Valentine of the University of California, Santa Barbara, also on the cruise, thinks measuring the methane could give a better estimate of oil flow than video or satellite imagery.)

But the burst well has also become an unlikely scientific windfall for Kessler, who studies natural methane seeps and their link to rapid climate change. Scientists think sudden, violent outflows of the gas from the sea floor might have spiked the planet's temperature about 55 million years ago, and they think the gulf spill affords them the unique opportunity to study an analog in real time.

Samples of ancient carbon deposits from this era show a marked increase in concentrations of carbon-12 relative to its heavier isotope carbon-13, indicating a lot of lighter carbon might have been suddenly released at the time.

"To cause this type of global isotopic shift, you'd have to take all terrestrial plants and burn them into carbon dioxide," Kessler says, which seems unlikely. That's led scientists to look for other culprits. "But if you look at methane in the sea floor, it's the lightest carbon source [isotopically] on the planet." So many scientists think a sea floor methane release is responsible. Additionally, because methane is a greenhouse gas roughly 25 times more potent than carbon dioxide, a big release would fit with "evidence that the temperature of the planet rose very dramatically" at that time, Kessler says.

But in the case of a big release of undersea methane, how much would escape the ocean to exert its greenhouse effects? "Knowing if it's 1% or 90% that makes it out to the atmosphere will be a very big discovery for us," says Kessler. If the methane stays dissolved, it could trigger a feeding frenzy among microbes, he says. Their consumption of oxygen could create hypoxic zones and have "a serious influence on biodiversity at those times as well,"

Answering these questions is "something we haven't been able to do without running the experiment," he says. The burst well offers just such an experiment, though at a smaller scale. So Kessler scrambled to arrange the cruise in less than 3 weeks, a process which usually takes 4 to 6 months. "Obviously, no one's ever going to allow us to dump tons of methane into the ocean to simulate one of these natural massive eruptions," says Kessler. (The amount of methane being released by the well is too little to affect climate, he says.)

But conducting a rigorous scientific study in a disaster zone has its own drawbacks, he acknowledges. "We're going to get as much as we can without being in the way," he says. They'll have to work around cleanup and containment efforts, but he says he's determined to both "get as close as we can to ground zero" and map the full extent of the plume "to get a very comprehensive map."

When it's time to place his instruments in the water, the real nail-biting begins, he says. Oceanographers generally don't usually work in oil slicks, which might damage their equipment. "Sending our instruments down through this layer of oil is something that's keeping me up at night."

Given the disaster unfolding in the gulf, says Kessler, "if we can make a little lemonade out of the lemons we've been given, then at least maybe some good will come of this."

For more on the gulf oil spill, see our full coverage.

http://news.sciencemag.org/scienceinsider/2010/06/what-the-gulf-disaster-could-tel.html?rss=1

Read more…

2010 Temperature Trends

Global Temperature Trend Update - June, 2010

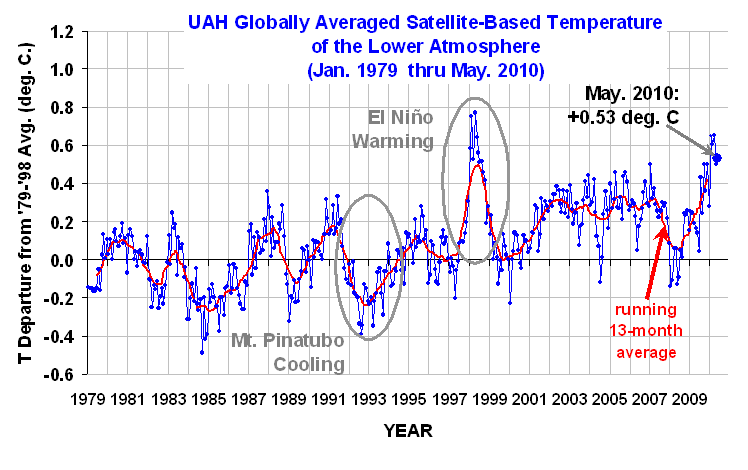
Every month University of Alabama in Huntsville climatologists John Christy and Roy Spencer report the latest global temperature trends from satellite data. Below are the newest data updated through May, 2010.

The data for the chart can be found here. The UAH press release puts the recent temperatures in context:


First five months of 2010 [are] second warmest on record

Global climate trend since Nov. 16, 1978: +0.14 C per decade

May temperatures (preliminary)

Global composite temp.: +0.53 C (about 0.95 degrees Fahrenheit) above 20-year average for May.

Northern Hemisphere: +0.78 C (about 1.40 degrees Fahrenheit) above 20-year average for May.

Southern Hemisphere: +0.29 C (about 0.52 degrees Fahrenheit) above 20-year average for April.

Tropics: +0.71 C (about 1.28 degrees Fahrenheit) above 20-year average for May.

(All temperature anomalies are based on a 20-year average (1979-1998) for the month reported.)

The press release included these notes on recent temperature trends:

In the race to become the warmest year in the satellite temperature record, 2010 is running a close second to 1998 but might begin to falter as the El Nino Pacific Ocean warming event continues to fade, according to Dr. John Christy, professor of atmospheric science and director of the Earth System Science Center at The University of Alabama in Huntsville.

Through the first 151 days of the year (Jan. 1 through May 31), 2010 has averaged 0.59 C warmer than season norms. Global average temperatures through the first five months of 1998 were 0.65 C warmer than normal.

The chance that 2010 will set a record drops as the El Nino warming event fades and the Central Pacific Ocean cools. NOAA has issued a "watch" for a La Nina Pacific Ocean cooling event.

For the third time in the past four months a new high temperature has been set for the Arctic. Temperatures in the Arctic -- latitude 60 N (about even with Helsinki and the southern tip of Greenland) to the North Pole -- were a full two and a half degrees Celsius (about 4.5 degrees Fahrenheit) warmer than seasonal norms for that region.

May 2010 set records as the warmest May in the 32-year satellite temperature record for both the Northern Hemisphere (+0.78 C) and the northern temperate zone, also +0.78 C.

Compared to the other 31 Mays in the record, May 2010 was the second warmest May globally (+0.53 C), and in the tropics (+0.81 C); fourth warmest May in the Southern Hemisphere (+0.29 C); and seventh coolest May in both the Southern Polar region (-0.86 C) and the continental U.S., where the average temperature was 0.47 C cooler than seasonal norms.

The top warmest months for various regions are also listed:

Global Temperature Anomalies
Year Mo
1. 1998 4 +0.76
2. 1998 2 +0.76
3. 2010* 3 +0.66
4. 1998 5 +0.65
5. 2010* 1 +0.64
6. 2010* 2 +0.61
7. 1998 1 +0.58
8. 1998 6 +0.57
9.*2010* 5 +0.54
10. 1998 3 +0.53
11. 1998 7 +0.52
12. 1998 8 +0.52
13. 2007 1 +0.51
14. 2010* 4 +0.5
15. 2009 9 +0.5
16. 2009 11 +0.5
17. 2005 10 +0.47
18. 2005 4 +0.46
19. 2003 12 +0.45
20. 1998 9 +0.45


Temperature Anomalies
in the Tropics
Year Mo
1. 1998 2 +1.3
2. 1998 1 +1.09
3. 1998 4 +1.06
4. 1998 3 +1.05
5. 1998 5 +0.89
6. 2010* 2 +0.81
7. 2010* 3 +0.73
8. 1997 12 +0.73
9.*2010* 5 +0.72
10. 2010* 1 +0.66
11. 2010* 4 +0.65
12. 1987 12 +0.62


Arctic Temperature Anomalies
Year Mo
1.*2010 5 +2.51
2. 2010* 4 +2.45
3. 2010* 2 +2.3
4. 2007 4 +2.27
5. 1995 4 +2.26
6. 2006 2 +2.24
7. 2009 12 +2.09
8. 2005 12 +2.06
9. 1996 11 +2.01
10. 2001 12 +1.94
11. 2003 10 +1.83
12. 2005 4 +1.81
13. 2005 11 +1.8
14. 2010* 1 +1.79
15. 2002 10 +1.73
16. 1981 1 +1.72
17. 2005 5 +1.72
18. 2010* 3 +1.72
19. 1980 2 +1.72
20. 2002 11 +1.72

Read more…
MWH Soft Ships InfoSWMM 2D: Next Generation of Two-Dimensional Hydrodynamic
Stormwater and Overland Flow Modeling


Highly Anticipated Release Equips Engineers with Unmatched Power to Predict Extent and Duration of
Urban and Rural Flooding for Comprehensive Stormwater Management

Broomfield, Colorado USA, May 19, 2010 — MWH Soft, a leading global innovator of wet infrastructure modeling and simulation software and technologies, today announced the worldwide availability of InfoSWMM 2D, a powerful, highly-advanced geospatial modeling solution for building and analyzing comprehensive 2D models that simulate urban stormwater, sanitary sewers, river flooding and pollutant transport. The breakthrough application allows engineers to accurately model two-dimensional (2D) above-ground urban and rural flooding combined with the power of one-dimensional (1D) hydraulic and water quality sewer systems analysis — all directly within the powerful ArcGIS (ESRI, Redlands, CA) environment.

The new product demonstrates MWH Soft’s ongoing commitment to delivering pioneering technology that raises the bar for urban drainage network modeling and simulation, helping to shape the future of this critical sector. It gives wastewater utilities the flexibility to continue to use InfoSWMM, the industry’s premier ArcGIS-centric urban drainage modeling solution, while gaining new power to predict the extent and duration of urban and rural flooding for comprehensive stormwater management.

A fully hydrodynamic geospatial stormwater modeling and management software application, InfoSWMM 2D can be used to model the entire land phase of the hydrologic cycle as applied to urban stormwater systems. The model can perform single-event or long-term (continuous) rainfall/runoff simulations accounting for climate, soil, land use, and topographic conditions of the watershed. In addition to simulating runoff quantity, InfoSWMM 2Dcan reliably predict runoff quality, including buildup and washoff of pollutants from primarily urban watersheds. It also features very sophisticated Real-Time Control (RTC) schemes for the operational control and management of hydraulic structures.

Built atop ArcGIS and using exceptionally robust and efficient numerical simulation capabilities, InfoSWMM 2Dseamlessly integrates advanced 1D and 2D functionalities in one environment, enabling users to model the most complex storm and combined sewer collection systems and surface flooding with incredible ease and accuracy.

When overland flows are routed through a complex urban area or highly varied terrain, the numerous elevation changes and obstacles can significantly impact results. This problem can be further complicated by the presence of sewer networks, where flows can both enter and exit the system during flood events. With InfoSWMM 2D,users can employ 1D simulation to identify the location of flooding and 2D simulation to investigate the direction and depth of flood flows in specific areas.

The full 2D free-surface shallow water equations are solved using a highly advanced finite volume method, which is particularly suitable for rapidly varying flood flows such as those through steep streets and road junctions and those associated with bank overtopping or breaching. The unparalleled 1D/2D dynamic linking capabilities ofInfoSWMM 2D give engineers the unprecedented power to analyze and predict potential flood extents, depth and velocity and accurately model the interaction of surface and underground systems in an integrated 1D/2D environment. The software can also be effectively used to simulate and analyze tidal surges, dam breaks and breaches on sewer networks. The combined water level and velocity results throughout the flooded areas can be viewed as graphs, tables or animated, thematic flood maps.

InfoSWMM 2D greatly extends the core features of InfoSWMM, providing the most powerful and comprehensive ArcGIS-centric tool kit ever for managing the risks of flooding,” said Paul F. Boulos, Ph.D., Hon.D.WRE, F.ASCE, President and COO of MWH Soft. “This milestone solution marks a new direction in advanced sewer collection systems simulation and analysis. It is the only GIS-centric analysis, design and management software users need to work faster and smarter in a competitive environment — not only to power system performance, but to safeguard critical wet infrastructures and maximize their effectiveness in protecting public health. This is the ultimate tool for accurately assessing the impacts of urban and rural flooding, then formulating and evaluating sound and cost-effective mitigation strategies. MWH Soft is very proud to offer this revolutionary product to our clients.”

Read more…
May 16, 2010, 6:12 PM

How Will They Spin This?

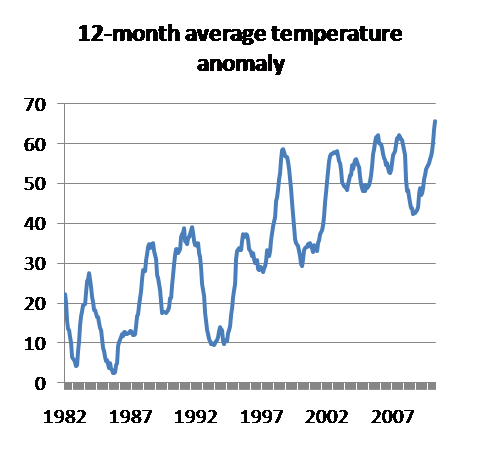
So, via Joe Romm, the NASA-GISS data show that the past 12 months were the hottest 12-month period on record. Here’s my plot of the temperature anomaly — the difference, in hundredths of a degree centigrade, from the average over 1951-80:

DESCRIPTIONGISS

So much for the “global cooling” talking point. What I’m wondering is what excuse the deniers will come up with.

They could argue that temperatures fluctuate, that one shouldn’t make too much of a particular peak — which is actually true. But that would get them in trouble, since the whole global cooling thing has been about taking the 1998 peak — visible in the chart — plus a bit of bad data to claim, literally, that up is down. Any statistical fix, like looking at multi-year averages, would just confirm that the temperature trend is up.

Now, I’m sure that the climate deniers will find a way to ignore the latest facts. But I’m not sure what that way will be.

Read more…

Prominent Ontario, Canada, City Selects InfoSWMM

Kitchener, Ontario, Looks to MWH Soft Advanced Technology to Support Its Wastewater and Stormwater Systems


Broomfield, Colorado USA, May 12, 2010 — MWH Soft, a leading global innovator of wet infrastructure modeling and simulation software and technologies, today announced that the City of Kitchener, Ontario, Canada, has chosen industry-leading InfoSWMM software as its advanced sanitary sewer and stormwater modeling and design solution. The decision helps the city leverage its investment in ArcGIS technology from ESRI (Redlands, CA) by giving it the most technologically advanced GIS-centric software platform available for managing and operating its wastewater and stormwater systems.

Kitchener is a city of over 200,000 people located approximately 70 miles (110 km) west of Toronto in Ontario’s “Technology Triangle”. Since its origins in the 1850’s, it has grown to be the 11th largest metropolitan area in Canada. Its sewer system contains over 12,000 pipe segments with an overall length over 480 miles (770 km).

Jonathan Harrison of the city’s engineering division said that Kitchener selected InfoSWMM after an intensive comparison process. “A core team of city employees from Engineering and GIS devised an objective weighting and scoring system,” he said. “Then we held a model selection workshop where the most commonly available model packages were scrutinized. We based our evaluations on a number of criteria related to our specific needs, including operational and technical requirements, general software capabilities, data management, costs, technical support availability, and software popularity amongst peers. Based on this rigorous process, we felt comfortable that InfoSWMM was the best fit for the city’s needs.”

“MWH Soft continues to expand its relationship with municipalities and utilities throughout North America,” said, J. Erick Heath, P.E., MWH Soft Vice President and Director of Americas Operations. “Kitchener’s thorough evaluation of the tools available in the marketplace and subsequent selection of InfoSWMM confirms that our products are performing at a high level for the industry and helping engineers create sustainable wet infrastructure.”

Built atop ArcGIS with native geodatabase support, InfoSWMM offers a single comprehensive, GIS-centric solution for analyzing and managing large and complex urban drainage systems. It can be used to model the entire land phase of the hydrologic cycle as applied to urban stormwater and wastewater collection systems. The model can perform single event or long-term (continuous) rainfall-runoff simulations accounting for climate, soil, land use, and topographic conditions of the watershed. In addition to simulating runoff quantity, InfoSWMMcan also predict runoff quality, including buildup and washoff of pollutants from primarily urban watersheds. Once runoff quantity and quality are simulated and wastewater loads at receiving junctions are determined, the routing portion of InfoSWMM transports this flow through a conveyance system of pipes, channels, storage/treatment devices, pumps, and hydraulic regulators such as weirs and orifices, using either steady, kinematic wave or dynamic wave routing. The model also offers very advanced Real-Time Control (RTC) schemes for the operational management of hydraulic structures.

Read more…

Weekend Diversion: Why is Oil in the oceans so frightening?

Category: EnvironmentPhysics
Posted on: May 2, 2010 1:41 PM, by Ethan Siegel

http://scienceblogs.com/seed-img/bg_blockquote.gif); background-repeat: repeat-y; background-attachment: initial; -webkit-background-clip: initial; -webkit-background-origin: initial; background-color: initial; quotes: none; background-position: 0px 0px; ">Either write something worth reading or do something worth writing. -Benjamin Franklin
Every weekend, I try to bring something light to you, but there's a lot of heavy stuff going on in the world right now. So instead of the usual, I'd like to tell you just a little bit about why putting even a little bit of oil in the oceans can be so disastrous.

And I can't think of a better modern voice to take us through that than Regina Spektor, whose voice reminds me of greats such as Nina Simone and Ella Fitzgerald. Take a listen to her song Apres Moi.

Apres Moi by Regina Spektor

Most of you know that if you take pretty much any type of oil, it will float on top of water.

oilandwater.jpg

But what if the amount of water you have is much, much larger than the amount of oil that you have? It turns out that the oil will spread out over the surface as much as possible.

How much is as much as possible? Until the oil on the surface of the water is just one molecule thick. So, how thick is one molecule of oil? Believe it or not, Ben Franklin was the first person to measure it, and you can measure it, too! All you need is some oil, an eyedropper, and a flat, clean body of water.

eyedropper.jpeg

The eyedropper is great, because a single drop of anything that comes out of an eyedropper is going to be almost exactly one milliliter of volume, or one cubic millimeter. That's tiny, isn't it? You'd have to line up one thousand drops in a line to get something one meter (a little over three feet) long. But when you drop just a single drop into a flat pool of water, it spreads out to make a circle that's huge!

oildropexperiment.jpg

This single drop, which was just a millimeter in size (about 1/25th of an inch), now spreads out to a diameter of 24 feet, or over seven meters!

If I work out my math, that means a single molecule of oil is only about 2 nanometers (or 20 Angstroms) thick!

(Beware of the number one hit on google, which unwittingly uses far less than a milliliter of water in their experiment, and gets an answer that's almost 50 times too large!)

Well, what does that mean if -- instead of a drop of oil -- I dump an entire gallon of oil into a large body of water?

1920s 1 Gallon Can.jpeg

It would spread out to make a circle that was 450 meters in diameter. That's over a quarter of a mile. From just one gallon (about 3.8 liters).

And what about the Oil Leak which is spilling oil into the gulf of Mexico right now?

29spill_337-span-articleLarge.jpeg

It's currently spilling an estimated 200,000 gallons of oil into the gulf of Mexico every day.

In other words, every day, a new 125,000 square kilometers (or 50,000 square miles) of ocean will eventually get coated in oil when it finishes spreading out. That's almost as big asNew York State.

Practically, of course, this much oil won't spread out to be one molecule thick; more like 100 molecules thick in most places, but that's still a huge disaster! Many of you will remember the Exxon Valdez spill and the consequences this caused:

PWS_tanker_oil_spill.jpeg

Well, the one in the Gulf of Mexico, as I write this, is only seventeen miles away from the Mississippi Delta. It's one thing to look at pictures of animals killed from an oil spill.

Exxon's oil coated this dead whale.jpeg

This isn't only about animals this time. This isn't happening in a corner of the world where very few people live. This is happening in a place that will affect millions of people. And by time this leak is fixed, we may well exceed the total volume dumped by the 1989 spill. This is about your world, your oceans, your environment and for many of you, your own health.

Read more…
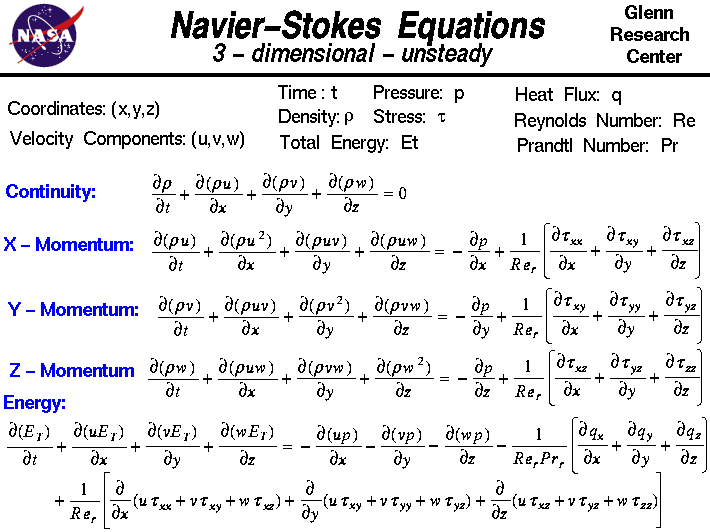
The Navier-Stokes equations of fluid dynamics in three-dimensional, unsteady form.

On this slide we show the three-dimensional unsteady form of the Navier-Stokes Equations. These equations describe how the velocity, pressure, temperature, and density of a moving fluid are related. The equations were derived independently by G.G. Stokes, in England, and M. Navier, in France, in the early 1800's. The equations are extensions of the Euler Equations and include the effects of viscosity on the flow. These equations are very complex, yet undergraduate engineering students are taught how to derive them in a process very similar to the derivation that we present on the conservation of momentum web page.

The equations are a set of coupled differential equations and could, in theory, be solved for a given flow problem by using methods from calculus. But, in practice, these equations are too difficult to solve analytically. In the past, engineers made further approximations and simplifications to the equation set until they had a group of equations that they could solve. Recently, high speed computers have been used to solve approximations to the equations using a variety of techniques like finite difference, finite volume, finite element, and spectral methods. This area of study is called Computational Fluid Dynamics or CFD.

The Navier-Stokes equations consists of a time-dependent continuity equation for conservation of mass, three time-dependent conservation of momentum equations and a time-dependent conservation of energy equation. There are four independent variables in the problem, the x, y, and z spatial coordinates of some domain, and the time t. There are six dependent variables; the pressure p, density r, and temperature T (which is contained in the energy equation through the total energy Et) and three components of the velocity vector; the u component is in the x direction, the v component is in the y direction, and the w component is in the z direction, All of the dependent variables are functions of all four independent variables. The differential equations are therefore partial differential equations and not the ordinary differential equations that you study in a beginning calculus class.

You will notice that the differential symbol is different than the usual "d /dt" or "d /dx" that you see for ordinary differential equations. The symbol "partial" is is used to indicate partial derivatives. The symbol indicates that we are to hold all of the independent variables fixed, except the variable next to symbol, when computing a derivative. The set of equations are:

Continuity: partialr/partialt + partial(r * u)/partialx + partial(r * v)/partialy + partial(r * w)/partialz = 0

X - Momentum: partial(r * u)/partialt + partial(r * u^2)/partialx + partial(r * u * v)/partialy + partial(r * u * w)/partialz = - partialp/partialx

+ 1/Re * { partialtauxx/partialx + partialtauxy/partialy + partialtauxz/partialz}

Y - Momentum: partial(r * v)/partialt + partial(r * u * v)/partialx + partial(r * v^2)/partialy + partial(r * v * w)/partialz = - partialp/partialy

+ 1/Re * { partialtauxy/partialx + partialtauyy/partialy + partialtauyz/partialz}

Z - Momentum: partial(r * w)/partialt + partial(r * u * w)/partialx + partial(r * v * w)/partialy + partial(r * w^2)/partialz = - partialp/partialz

+ 1/Re * { partialtauxz/partialx + partialtauyz/partialy + partialtauzz/partialz}

Energy: partialEt/partialt + partial(u * Et)/partialx + partial(v * Et)/partialy + partial(w * Et)/partialz = - partial(r * u)/partialx - partial(r * v)/partialy - partial(r * w)/partialz

- 1/(Re*Pr) * { partialqx/partialx + partialqy/partialy + partialqz/partialz}

+ 1/Re * {partial(u * tauxx + v * tauxy + w * tauxz)/partialx + partial(u * tauxy + v * tauyy + w * tauxz)/partialy + partial(u * tauxz + v * tauyz + w * tauzz)/partialz}

where Re is the Reynolds number which is a similarity parameter that is the ratio of the scaling of the inertia of the flow to the viscous forces in the flow. The q variables are the heat flux components and Pr is the Prandtl number which is a similarity parameter that is the ratio of the viscous stresses to the thermal stresses. The tau variables are components of the stress tensor. A tensor is generated when you multiply two vectors in a certain way. Our velocity vector has three components; the stress tensor has nine components. Each component of the stress tensor is itself a second derivative of the velocity components.

The terms on the left hand side of the momentum equations are called the convection terms of the equations. Convectionis a physical process that occurs in a flow of gas in which some property is transported by the ordered motion of the flow. The terms on the right hand side of the momentum equations that are multiplied by the inverse Reynolds number are called the diffusion terms. Diffusion is a physical process that occurs in a flow of gas in which some property is transported by the random motion of the molecules of the gas. Diffusion is related to the stress tensor and to the viscosity of the gas. Turbulence, and the generation of boundary layers, are the result of diffusion in the flow. The Euler equations contain only the convection terms of the Navier-Stokes equations and can not, therefore, model boundary layers. There is a special simplification of the Navier-Stokes equations that describe boundary layer flows.

Notice that all of the dependent variables appear in each equation. To solve a flow problem, you have to solve all five equations simultaneously; that is why we call this a coupled system of equations. There are actually some other equation that are required to solve this system. We only show five equations for six unknowns. An equation of state relates the pressure, temperature, and density of the gas. And we need to specify all of the terms of the stress tensor. In CFD the stress tensor terms are often approximated by a turbulence model.


Source


Read more…

MWH Soft Releases InfoSWMM Version 9

MWH Soft Releases InfoSWMM Version 9 with Powerful New Capabilities
to Help Users Work Smarter and Faster

Leading GIS-Centric Urban Draining Analysis and Design Software Sets New Standard For Power, Speed,
Functionality and Performance with New Simulation Task Manager for an Improved Modeling Experience


Broomfield, Colorado USA, May 5, 2010 — In its ongoing quest to equip the global wastewater industry with the world’s most comprehensive and innovative GIS-centric modeling and design solutions, MWH Soft, a leading global innovator of wet infrastructure modeling and simulation software and technologies, today announced the worldwide availability of the V9 Generation of its industry-leading InfoSWMM for ArcGIS (ESRI, Redlands, CA).

The latest release marks the most significant milestone to date in the evolution of the company’s flagship urban drainage modeling and design product, firmly establishing it as the number one geocentric choice for the effective evaluation, design, management, rehabilitation and operation of wastewater and stormwater collection systems. The software provides unmatched benefits with an unprecedented combination of power, functionality, seamless ArcGIS integration and ease of use.

Underlining MWH Soft’s leadership in the wastewater industry, InfoSWMM reflects the company’s constant commitment to delivering pioneering technology that helps to shape the future of this critical sector by raising the bar for urban drainage network modeling. The world’s first and only urban drainage modeling solution certified by the National Association of GIS-Centric Software, the full-featured analysis and design program delivers the highest rate of return in the industry. All operations of a typical sewer system — from analysis and design to management functions such as water quality assessment, pollution prediction, sediment transport and deposition, urban flooding, real-time control and record keeping — are addressed in a single, fully integrated geoengineering environment whose powerful hydraulic computational engine is endorsed by the USEPA and certified by FEMA.

Focused on expanded geospatial functions and performance, V9 features a host of new capabilities to help wastewater engineers and planners develop better designs and operational improvements faster and more efficiently. They include an intuitive, time-saving user interface; impressive graphics; greatly accelerated creation of better, more accurate models; and more advanced design analysis capabilities than any other wastewater modeling software.

V9 gives users unprecedented power in managing urban runoff and wet weather water quality problems in combined, sanitary and storm sewers; optimizing BMP and LID designs; and meeting SSO and CSO regulations. Multiple hydrology and infiltration methods, coupled with highly sophisticated Real-Time Control (RTC) schemes, optimize the operational management of wastewater systems and hydraulic structures. Unparalleled performance modeling sets new benchmarks in scalability, reliability, functionality and flexibility within the powerful ArcGIS environment.

InfoSWMM V9 addresses scores of customer-requested enhancements and features, along with significant innovations that break new ground in productivity and efficiency for engineering GIS modeling. It adds first-ever capabilities like the revolutionary Simulation Task Manager, which allows users to launch multiple simulations as they continue their engineering work on any selected project as all simulation requests (jobs) are automatically managed in a separate, multi-threaded background service. Existing output data remains accessible until a new project output becomes available. Users can even close their working projects, and scheduled simulations will continue to be executed. A comprehensive user-friendly interface allows users to browse the entire job queue; visualize the active simulation progress and messages; and have full control over the submitted simulation jobs, including elevating their execution orders, times, priorities, or canceling unwanted jobs. This powerful and unique feature takes advantage of today’s multi-core processor and multi-thread OS to perform resource-intensive hydraulic simulations in the background, enabling foreground applications to remain interactive.

InfoSWMM is quickly becoming the must-have solution for comprehensive enterprise-wide geospatial urban drainage and sewer systems engineering. With its intuitive GIS-centric working environment and new cutting-edge features, Generation V9 delivers unmatched capabilities to the industry, backed by unparalleled technical support. “InfoSWMM V9 contains an array of new features and enhanced capabilities for both new and existing customers,” said Paul F. Boulos, Ph.D, Hon.D.WRE, F.ASCE, President and Chief Operating Officer of MWH Soft. “It reflects our company’s continued commitment to consistently delivering best-in-class sewer modeling and design technology.

“We’ve combined the best technological innovations of MWH Soft’s R&D with the requests of our customers to produce one of the most significant product releases in our history in terms of usability, power and performance,” Boulos continued. “This marks the pinnacle in a series of product innovations that have set InfoSWMM far apart from its competitors. This level of innovation is typical of our entire product portfolio, which is unequaled in breadth, depth and best-in-class solutions. The advances we make empower our customers to find the best possible solutions in the least amount of time using the fewest resources. Because they can be accessed by any user, regardless of technical expertise, these benefits can be extended across the entire enterprise. We are thrilled to make this one-of-a-kind product available to the extended wastewater and urban drainage modeling communities.”

Read more…

Iceland Volcano from Starts with a Bang

u are caught on a golf course during a storm and are afraid of lightning, hold up a 1-iron. Not even God can hit a 1-iron.
-Lee Trevino, golfer who actually has been struck by lightning. Today's astronomy picture of the day is absolutely gorgeous.
See Explanation. Clicking on the picture will download%0A the highest resolution version available.jpeg

Of course, this is the Icelandic volcano, Eyjafjallajökull, erupting and spewing up volcanic ash. But, of course, the most interesting part of this picture is the lightning, which looks like it both originates and ends in the Volcanic ash itself!

lightning close.jpg

(Image credit for both images above: Marco Fulle, via helicopter.)

First off, I'd like to be concrete about this. The way it looks -- that the lightning originates in the volcanic ash -- is exactly the way it is! This isn't some "lucky shot" by a photographer, either. Check out this picture of Eyjafjallajökull from April 17th.

Lightnings1.jpeg

(Image credit: Snaevarr Gudmundsson, through Universe Today.)

Is it just this volcano? Eyjafjallajökull, it turns out, is not remarkable at all for having volcanic lightning. If we look at some other major recent eruptions, we can see volcanic lightning in the ash there as well. Here's Chile's Chaitin volcano, from its 2008 eruption.

PHOTOS: Chile Volcano Erupts With Ash, Lava, Lightning.jpeg

(Image courtesy of National Geographic.)

And here's another one: Sakurajima, from its eruption in 1991.

050131volcaniclightning.jpeg

(Image credit: Sakurajima Volcananological Observatory.)

All told, there have been more than 150 different eruptions over the past couple of centuries where volcanic lightning has been recorded. In fact, I've managed to dig up some photographs of volcanic lightning from before I was born! Here's Mount Vesuvius -- and the accompanying volcanic lightning -- from 1944!

vesuvius lightning.jpg

(Courtesy of an old tripod.com website.)

Okay, so now you're convinced that lightning happens in volcanic ash all the time. Yes, it makes for a spectacular picture, but how do you get this in the first place?

Well, what is lightning? You create a big enough electric potential difference between two places, and you can get all of these excess charges to "jump down" to the lower potential. In air, it takes a voltage of about 33,000 Volts (!) to get a spark to jump even one centimeter! Lightning that goes from a high cloud down to the ground can have a voltage difference in excess of a billion Volts!

lightning-1.jpeg

You can do this because you can get a huge amount of charge separation. For example, in a big lightning strike, you separate out about 1020 electrons! But ash and rocks -- even molten rock -- are electrically neutral, right? So how to we get a big voltage from neutral matter?

Thankfully, the ash that comes out is hot enough so that not every particle is neutral: many are positively charged ions and many are negatively charged ions.

ionsInWater.jpeg

If you can make something push the positive ions differently than it pushes the negative ones, you can create a charge separation! If you get enough charges separated, you can make a large enough voltage to give you lightning!

Lightning.jpeg

This should be easy, because when you get charged particles moving around, you make electric and magnetic fields, which is exactly the ingredient you need to separate these charges. As long as these fields are here, differently charged ions are doomed to separate away from one another! And as soon as you get a large enough charge accumulated in different parts of the sky, that's the tipping point, and then you get lightning!

And for those of you who like details with your pretty pictures and explanations, there is some uncertainty as to the exact mechanism that gives you this separation of charge. (Some ideas are here, and some research into the topic is available here.) But this really is lightning from within the volcanic ash! It certainly makes for quite a show, so enjoy it, but enjoy it from a safe distance!

Reblog this post [with Zemanta]
Read more…

Where Did Water Come From?

ScienceShot: Where Did Water Come From?

on April 14, 2010 2:48 PM
sn-dustcloud.jpg
Credit: NASA/JPL-Caltech/L. Allen (Harvard-Smithsonian CfA)

Water, water everywhere—but where did it come from? From icy comets to Earth's vast oceans, our solar system is chock full of water, yet so far no one has been able to demonstrate how it formed in the first place. Getting atomic oxygen and molecular hydrogen to combine in the deep, cold vacuum of space is nearly impossible. Scientists think the answer may lie in a dusty interstellar cloud, like the one shown here. A team reports today at a meeting of the Royal Astronomical Society in Glasgow, United Kingdom, that each grain of interstellar dust provides a reactive surface on which wayward hydrogen and oxygen can combine into H2O. Eventually the two elements form an icy coating on the grain, the grains in the cloud condense gravitationally, and presto! Comets, icy moons, and seas galore.

Read more…

70 years of scientific materialism doesn’t make you pro-science

Chris Mooney points me to some data on scientific knowledge indicators published by the NSF. There’s a controversy whereby evolution and Big Bang related questions seem to have been removed because American religious Fundamentalism tended to produce a rejection of sane consensus in these areas. Science pointed to the unedited chapters which have some international comparisons. I’ve reformatted a figure from page 103 below. No surprise that American comes out badly on evolution and the Big Bang, but what always strikes me when Russia is included in the list is how skeptical citizens are to conventional science. If you poke around the World Values Surveyyou don’t find the Russians to be a particularly religious nation, at least compared to Poland or the United States, despite a general shift back toward nominal Orthodox Christian affiliation after the fall of Communism. Rather, I suspect Russian rejection of mainstream science probably has its roots more in a broader skepticism of institutional elite knowledge. After all, the Marxist ideology under which they were tyrannized for 70 years made the pretense of being scientific and positivistic.

chapter7_all103

The line in the middle of the bar graph is 50%, and all the bars represent correct responses.

April 9th, 2010 Tags: , ,
by Razib Khan in Creationism, Culture | 10 comments | RSS feed | Trackback >

http://blogs.discovermagazine.com/gnxp/2010/04/70-years-of-scientific-materialism-doesnt-make-you-pro-science/

Read more…

Did the Universe start from a Singularity?

Category: GravityPhysicsbig bang


http://scienceblogs.com/seed-img/bg_blockquote.gif); background-attachment: initial; background-origin: initial; background-clip: initial; background-color: initial; quotes: none; background-position: 0px 0px; background-repeat: no-repeat repeat; ">The most formidable weapon against errors of every kind is reason. I have never used any other, and I trust I never shall. -Thomas Paine
I've been telling you the history of the Universe over the past few months in serial. Parts 1through 8 are currently up, and have taken us from Inflation up through the formation of neutral atoms, covering the first 380,000 years of the Universe. During this whole time, like a giant balloon, space has been expanding.


FG26_005.jpeg

One thing I haven't paid much mind to is just how the Universe has been expanding during this time. The concept is relatively straightforward: the Universe expands faster based on the amount of energy density in it. More matter and energy packed inside a smaller volume means faster expansion.

What does this means for our Universe, which spends most of its time expanding and cooling?

I02-06-expansion.jpeg

If we want to know how the Universe expands, we need to know its energy density at any given time. Well, there are three general types of things that make up the Universe, and they're important at different times. What are they?

High Five.jpeg

1.) Matter. Normal matter is stuff like you and me... stuff with mass. As the Universe expands, the matter density dilutes. You may remember that density is just mass over volume, and so as the volume increases, the energy decreases.

Expansion4.jpeg

2.) Radiation. Radiation is stuff with either no mass or very little mass, like photons or (sometimes) neutrinos, which move either at or extremely close to the speed of light. But unlike matter, radiation loses extra energy as the Universe expands!

How? The energy intrinsic to radiation is determined by its wavelength. Long wavelength photons (like radio waves) have less energy than short wavelength ones (like X-rays). But as the Universe expands, in addition to volume increasing (as it does for matter), the wavelengths also get stretched. This means that a Universe full of radiation loses energyfaster than a comparable Universe filled with matter.

dark_energy_2.jpeg

3.) A constant energy source. It's also possible for space to be filled with a constant source of energy that doesn't dilute as the Universe expand. This not only happens in our Universe, it looks like it has all happened before (during inflation), and like it's all happening again (with dark energy)! In this case, the expansion rate remains constant, and the energy density also remains constant as long as the Universe is full of this type of energy.

So, what does this mean for our Universe's beginning? We know it's expanding and cooling, we know it has matter and radiation in it now, and we know that before that, towards the beginning (see parts 1 and 2 of my series), it had a constant source of energy in it. What I'd like to do is to work backwards from now, and ask whether the Universe started from a singularity or not?

universe_expansion.png

Well, diagrams on the internet aren't going to hold the answer. For billions of years, until the recent takeover of dark energy, the Universe was dominated by matter. Prior to that, though, when the Universe was only a few thousand years old (and earlier), the radiation was more energetic! It lost its energy more quickly due to that extra "stretching" of its wavelength, but for the first few thousand years, the Universe was dominated by radiation. And then if we go back even farther -- towards the instant the big bang was created at the end of inflation -- we come to the epoch of inflation, where the Universe is dominated by aconstant energy source, and expands exponentially. Let's compare, graphically, what these three cases look like. (The next three graphs -- unlike most of the ones on this blog -- were generated by me.)

expansion of universe.jpg

Well, quite clearly, a Universe with exponential expansion expands the fastest over time, and one with matter expands faster than one with radiation. No big deal. But I want to gobackwards, and take a look at what happens when we extrapolate back to a time where the size of the Universe should shrink to zero! After all, that's what a singularity is defined to be, where all of the matter and energy in the Universe is concentrated in a single point. Let's calculate it and see what we get.

Expansion Universe 2.jpg

What's this?! A Universe with matter or radiation totally has a singularity at time t=0, but -- and this is very, very important -- an inflating Universe does not! In fact, we can take the inflating, exponentially expanding Universe back arbitrarily far, and what do we find?

Expansion Universe 3.jpg

It never reaches a size of zero! If you want an inflating Universe to have a singularity, you need to go back an infinite amount of time! Physically, of course, we can't do that. The only information we have about inflation is from whatever comes at the very end of it. Everything else is wiped away from our field of view by the exponential expansion!

So what does this all mean? It means the idea that our Universe started from a singularity was a very good one back when we thought that the only important things in our Universe were matter and radiation, but now that we know about inflation, there is no reason to believe that our Universe ever had a singularity in the past.

And this is different from what you'll read almost everywhere -- on the internet, in textbooks, even at many colleges and Universities -- but it's right. Now that we know about inflation, it's time to admit that we can't with any sort of certainty speak about what came before it. That means there is no reason to believe that our Universe came from a singularity, and this outdated idea should have died as soon as inflation was accepted.

And isn't that a surprise for most of us! So my answer -- to the best of our current knowledge about the Universe -- is no, it didn't. What do you think about that?

Source: http://scienceblogs.com/startswithabang/2010/04/did_the_universe_start_from_a.php

Read more…

Inform tica y pdas otras categor as


El sitio de compras PrecioLandia es una red de transacciones comerciales online, la mayor que existe mientras y sin competencia en la peninsula iberica.


A pesar de que en los ultimos tiempos se ha aumentado en la seguridad y la protección al comprador, es indispensable no dejar de tomar en cuenta que cualquier operacion de compra o venta en Preciolandia.es es un acuerdo contractual en el que no media la empresa , por lo cual el buen termino de la transacción depende de el compromiso de los usuarios. Preciolandia España en realidad es un sistema de intermediación, en el cual los usuarios registrados tienen manera de dar un "rate" al otro usuario utilizando un sistema de puntos positivos o negativos, dependiendo del éxito de la transaccion comercial . No obstante, este sistema se ha demostrado habitualmente como fácilmente manipulable, razón por la cual debe tenerse en cuenta el "due diligence" y sobre todo verificar la reputacion online del usuario que ofrece el articulo.


En la actualidad en Preciolandia.com/es/ se hallan productos y servicios de gran cantidad de ciudades de España: Las Palmas, Sevilla, Bilbao y mas.

Here is more regarding Dietas y control de peso look into www.preciolandia.com/es/dietas-y-control-de-peso-939/deno1.html
Read more…
Boonsriforsite_large

Boonsri Dickinson

JAUNTSETTER OF THE WEEK
March 31, 2010
Journalist

Best trip souvenir: A dinosaur bone. Jealous?

Least favorite mode of travel: I avoid getting on a boat at all costs. I've never had a good trip involving a boat. The cruise to the Bahamas wasn't exactly my idea of fun. Not only was I stuck out at sea, there was only so much shuffle board one can play before getting bored.

Most romantic trip you've taken/want to take:I've never been on a romantic trip. I want to go on one this year to Thailand, and visit the beaches,Bangkok, and the countryside. I want to redo my trip to Thailand. The last time I went, it wasn't glamorous. I stayed with my mom's family and I felt restricted to shopping and eating. I did ride an elephant and see aspects of the Thai culture that changed my life. In fact, it was the first time I accepted the Thai side of me. But I wanted to explore, so my trip felt rather unsatisfying. I'd like to give Thailand another chance. I'd love to find the perfect guy to go with me.

Your biggest overall travel tip: If your friend is going on a business trip, tag along. I recently went to LA that way. Yes, the free hotel and free rental car were nice. But the best perk was having really great company for the week.

How do you make business travel fun? I actually travel more for business for than for fun. As a journalist, my stories can lead me to interesting places. The last business trip I took was a dino digging adventure in Montana. I camped in the badlands with Jack Horner, the famous paleontologist, and his team. We celebrated the Fourth of July with burgers and beer. I'll remember that day because we found a dinosaur and Horner named the specimen — "The Four Babes Trike" — after me, my friend, his girlfriend, and her friend.

First thing you do when you check into a hotel: I put on my running shoes, grab my iPhone for music, and hit the road. It's the best way to get to know a place.

Traveling with a tour group - yay or nay? I don't think I would travel with a tour group now. But if it's your first time going abroad, then it's not a bad idea. When I was 20, I wanted to travel to Europe but I didn't want to go solo. So I booked a 30 day bus tour through Contiki to travel to Western Europe. I was one of 3 Americans, the rest on board were Australian and South African. The bus ride was for sleeping, the day was for sight seeing, and the night was for drinking. We checked off all the major tourist attractions and ate delicious food. When we stayed in Corfu, we had a toga party. Some how the night ended with all 30 of us skinny dipping in the ocean. Sometimes, I secretly crave going on another Contiki tour.

One place everyone should go: Go down under. Visit Sydney, Australia. I loved running along the cliffs along the stretch between Coogee beach and Bondi beach. While you're at it, book a cheap flight over to New Zealand. Rent a car and you can see volcanoes, glaciers, gold mines, sheep, and sandy beaches in less than two weeks. If you want to save some money, stay at the Sydney Central YHA. It's the best one I've ever stayed in and is central to all the major sites in the city. When you're by the Opera House, check out Minus 5, for the ultimate ice bar experience. P.S. Don't wear ripped jeans like I did! In New Zealand, make sure you visit Rotorua. It might smell like sulphur there, but the geysers, volcanic rock, and hot springs will take your breath away.

Best hotel you've ever stayed at: The Standard in New York, actually. Breathtaking views. I took one of the best showers there. Definitely a great escape even if you can't get out of the city.

Recent spontaneous trip: I went with a journalist friend to JFK at 6 am to fly stand-by to visit my medical school friend in Granada. But we were flying out on President’s Day weekend and I didn’t realize every New Yorker was headed south too. We were told we wouldn’t make the flight to Miami and would never get to Granada. So we asked the Delta ticket agent what other destinations we could try. My friend wanted to go to Japan. But I wanted to go to Aruba. After all, I was packed for the beach. So we tried Aruba first. I was so excited that we made the flight. As soon as we boarded, we realized we didn’t have a place to stay. So I asked the nice banker/teacher couple sitting next to me for some recommendations. They ended up offering me a place in their timeshare for $100 a night at the Marriott. We trusted them and went with it: For the price of a cheap motel, we were staying at a luxurious resort. The benefits didn't stop there either. The couple then snuck me free breakfast, let us use their tennis rackets, and invited us to the exclusive cocktail hour. Lesson learned: don't write off timeshares. They can be pretty nice.
Read more…

Did Climate Influence Angkor's Collapse?

Did Climate Influence Angkor's Collapse? Evidence Suggests Changing Environment Can Bring Down a Civilization

ScienceDaily (Mar. 30, 2010) — Decades of drought, interspersed with intense monsoon rains, may have helped bring about the fall of Cambodia's ancient Khmer civilization at Angkor nearly 600 years ago, according to an analysis of tree rings, archeological remains and other evidence. The study, published in the journal Proceedings of the National Academy of Sciences, may also shed light on what drives -- and disrupts -- the rainy season across much of Asia, which waters crops for nearly half the world's population.


The religious complex of Angkor Wat was center of a civilization that depended for irrigation on a vast network of canals, embankments and reservoirs. (Credit: Charles J. Sharp)

Historians have offered various explanations for the fall of an empire that stretched across much of Southeast Asia between the 9th and 14th centuries, from deforestation to conflict with rival kingdoms. But the new study offers the strongest evidence yet that two severe droughts, punctuated by bouts of heavy monsoon rain, may have weakened the empire by shrinking water supplies for drinking and agriculture, and damaging Angkor's vast irrigation system, which was central to its economy. The kingdom is thought to have collapsed in 1431 after a raid by the Siamese from present-day Thailand. The carved stone temples of its religious center, Angkor Wat, are today a major tourist destination, but much of the rest of the civilization has sunk back into the landscape.

"Angkor at that time faced a number of problems -- social, political and cultural. Environmental change pushed the ancient Khmers to the limit and they weren't able to adapt," said the study's lead author, Brendan Buckley, a climate scientist and tree-ring specialist at Columbia University's Lamont-Doherty Earth Observatory. "I wouldn't say climate caused the collapse, but a 30-year drought had to have had an impact."

Scientists led by Buckley were able to reconstruct 759 years of past climate in the region surrounding Angkor by studying the annual growth rings of a cypress tree, Fokienia hodginsii, growing in the highlands of Vietnam's Bidoup Nui Ba National Park, about 700 kilometers away. By hiking high into the mountain cloud forests, the researchers were able to find rare specimens over 1,000 years old that had not been touched by loggers. After extracting tiny cores of wood showing the trees' annual growth rings, researchers reconstructed year-to-year moisture levels in this part of Southeast Asia from 1250 to 2008. The tree rings revealed evidence of a mega-drought lasting three decades -- from the 1330s to 1360s-- followed by a more severe but shorter drought from the 1400s to 1420s. Written records corroborate the latter drought, which may have been felt as far away as Sri Lanka and central China.

The droughts may have been devastating for a civilization dependent on farming and an irrigation system of reservoirs, canals and embankments sprawling across more than a thousand square kilometers. The droughts could have led to crop failure and a rise in infectious disease, and both problems would have been exacerbated by the density of the population, Buckley says.

The study also finds that the droughts were punctuated by several extraordinarily intense rainy seasons that may have damaged Angkor's hydraulic system. During a normal monsoon season, Angkor's hydraulic network could have handled heavy downpours, but after extended droughts, the system may have been vulnerable to massive siltation and clogging, the study suggests. Layers of coarse debris and other sediments found blocking some canals appear to have been laid down suddenly. In other spots, apparently sudden erosion cut canals as much as 8 meters below the surrounding landscape, potentially destabilizing the hydraulic system. Archeologists have found additional evidence that canals were rebuilt and rerouted to cope with water shortages.

In compiling the longest tropical tree ring record to date, researchers found that the third-driest, and the driest, years in the last 760 years occurred back to back in 1402 and 1403, about three decades before Angkor's fall. The second driest was 1888, which coincided with the 1888-1889 El Niño, a cyclical warming of the tropical Pacific Ocean. By correlating known El Niño cycles measured with modern instruments, researchers have documented how the cyclical warming and cooling of the tropical Pacific Ocean brings rain to some places and drought to others. The authors of the current study and other researchers suggest that El Niño, possibly abetted by longer, decades-long cycles across the Pacific basin, may have played an important role in shutting down the monsoon rains in this region, creating withering droughts in the past. Some scientists suspect that warming of the global climate may intensify these cycles in the future, raising the possibility of alternating Angkor-like droughts and destructive floods that could affect billions of people.

Similar studies suggest that abrupt environmental changes may have pushed other ancient civilizations over the edge, including the Anasazi people of the southwestern United States; the Maya people of Central America, and the Akkadian people of Mesopotamia. There is some evidence that other once-powerful kingdoms in what is now Vietnam and Myanmar may have fallen during the late 1700s, following extreme dry and wet periods.

"Both human society and the erth's climate system are complex systems capable of unexpected behavior. Through the long-term perspective offered by climate and archaeological records, we can start to identify and understand the myriad ways they may interact," said study coauthor Kevin Anchukaitis, a tree ring scientist at Lamont. "The evidence from monsoon Asia should remind us that complex civilizations are still quite vulnerable to climate variability and change."

Adapted from materials provided by The Earth Institute at Columbia University.


Journal Reference:

  1. Brendan M. Buckley, Kevin J. Anchukaitis, Daniel Penny, Roland Fletcher, Edward R. Cook, Masaki Sano, Le Canh Nam, Aroonrut Wichienkeeo, Ton That Minh, and Truong Mai Hong. Climate as a contributing factor in the demise of Angkor, Cambodia. Proceedings of the National Academy of Sciences, 2010; DOI:10.1073/pnas.0910827107

Read more…

The Success of Environmental Regulation

The Success of Environmental Regulation

In the 1970s, many scientists felt that the planet was on an unsustainable course in terms of pollution. Which is how we had the blossoming of the environmentalist movement. The creation fo the Earth Day holiday. The growth of “green” parties in Europe’s multi-party system and the rising influence of environmental interest groups in the United States. We passed the Clean Air Act and created the Environmental Protection Agency. And as Mark Perry from the conservative American Enterprise Institute points out these environmental policies worked and the air is now far cleaner:

earthday1 1

Except because Perry, like most conservatives, is completely unwilling to admit that liberals have ever been right about anything somehow reads this as evidence that environmentalists were wrong. You see, according to Perry we had all these proclamations of ecological doom and yet things have gotten better—silly greens!

In the real world, what happened is that we passed environmental laws, and conservatives argued that they would destroy the economy. And yet here’s the economy, undestroyed. And here’s the environment, cleaned up.


From Matt Yglesias

Read more…