All Posts (522)

Sort by

Storage Volume vs Depth Equation in SWMM 5

Subject:  Storage Volume vs Depth Equation in SWMM 5


A storage node in SWMM 5 can have either a functional form or a tabular depth/area table.  The area functional form of a storage node is:


Area                A * Depth^B + C  and the Volume has the form in  node.c of the SWMM 5 of


Volume          A/(B+1)*Depth^(1+B) + C*Depth


For example if C is 25 square meters, A is 20 and the exponent B is 0.5 we get the following values for area and volume and you can also plot a Scatter Plot of Volume vs Depth in SWMM 5 (Figure 1).


Depth

Area

Volume

Meters

M^2

M^3

0

0.00

0.00

1

45.00

38.33

2

78.28

87.71

3

109.64

144.28

4

140.00

206.67

5

169.72

274.07

6

198.99

345.96

7

227.92

421.94

8

256.57

501.70

9

285.00

585.00

10

313.25

671.64

11

341.33

761.44

12

369.28

854.26


Table 1.  Area and Volume for a Storage Node in SWMM 5.


Image004

Figure 1.  You can use a Scatter Graph in SWMM 5 to show the relationship between Volume and Depth.


Read more…

Subject:  Lambda Calculus in the SWMM 5 Dynamic Wave Solution


SWMM 5 uses the method of Successive under-relaxation to solve the Node Continuity Equation and the Link Momentum/Continuity Equation for a time step.  The dynamic wave solution in dynwave.c will use up to 8 iterations to reach convergence before moving onto the next time step.  The differences between the link flows and node depths are typically small (in a non pumping system) and normally converge within a few iterations unless you are using too large a time step.  The number of iterations is a minimum of two with the 1st iteration NOT using the under-relaxation parameter omega. The solution method can be term successive approximation, fixed iteration or Picard Iteration, fixed-point combinatory, iterated function and Lambda CalculusIn computer science, iterated functions occur as a special case of recursive functions, which in turn anchor the study of such broad topics as lambda calculus, or narrower ones, such as the denotational semantics

 of computer programs (http://en.wikipedia.org/wiki/Iterated_function). 


In the SWMM 5 application of this various named iteration process there are three main concepts for starting, iterating and stopping the iteration process during one time step:


·         The 1st guess of the new node depth or link flow is the current link flow (Figure 3) and the new estimated node depths and link flows are used at each iteration to estimate the new time step depth or flow.  For example, in the node depth (H) equation dH/dt = dQ/A the value of dQ or the change in flow and the value of A or Area is updated at each iteration based on the last iteration’s value of all node depths and link flows.  


·         A bound or a bracket on each node depth or link flow iteration value is used by averaging the last iteration value with the new iteration value.  This places a boundary on how fast a node depth or link flow can change per iteration – it is always ½ of the change during the iteration (Figure 1).  


·         The Stopping Tolerance (Figure 2) determines how many iterations it takes to reach convergence and move out of the iteration process for this time step to the next time step.

Image005

Figure 1.  Under relaxation with an omega value of ½ is done on iterations 2 through a possible 8 in SWMM 5. This is not done for iteration 1.

Image008

Figure 2.  if the change in the Node Depth is less than the stopping tolerance in SWMM 5 the node is considered converged.  The stopping tolerance has a default value of 0.005 feet in SWMM 5.0.022. 


Image002

Figure 3.  The differences between the link flows and node depths are typically small (in a non pumping system) and normally converge within a few iterations unless you are using too large a time step.  The number of iterations is a minimum of two with the 1st iteration NOT using the under-relaxation parameter omega.

Read more…

Subject: InfoSWMM and H2OMAP SWMM Import and Export of HEC-RAS Geometry Data

InfoSWMM v11 and H2OMAP SWMM v10 have new import and export features for HEC-RAS interaction.   The echange commands are in the exchange menu (Table 1) and you can import HEC-RAS geometry files (Figure 1), edit imported Transect Data (Figure 2 and 3) and export the data back to a HEC-RAS geometry file (Figure 4 and 5 and Table 2).


Exchange

Import Manager

Exchange

Export Manager

Exchange

ODBC Exchange

Exchange

Import Generate File

Exchange

Import…

Exchange

(Conveyance Nodes)

Exchange

Conveyance (Links)

Exchange

(Disable Auto-Length Calculation)

Exchange

Export…

Exchange

Export Generate File

Exchange

(Conveyance Nodes)

Exchange

Conveyance (Links)

Exchange

(Disable Auto-Length Calculation)

Exchange

Convert Polyline

Exchange

Import EPA SWMM 5

Exchange

Export EPA SWMM 5

Exchange

Import HEC-RAS Data

Exchange

Export HEC-RAS Data

Exchange

Export Hotstart File

Exchange

Append Nodes

Exchange

GIS Gateway


Table 1.  Exchange commands in InfoSWMM and/or H2OMAP SWMM


Image004

Image005


Figure 1.   Import HEC-RAS command imports Geometry Files which will have the extension go1, go2 etc.


Image006

Figure 2.   The imported Transects can be viewed and edited in the Operations Tab  of the InfoSWMM Browser.


Image007

Figure 3.   The imported Transects can be used as a SWMM 5 Irregular Channel Transect.


Image002


Figure 4.   Export HEC-RAS command exports a geometry file containing the active Transects in InfoSWMM.


Image003

Figure 5.   Export HEC-RAS allows you to choose a directory and a name for the exported geometry file.


GEOM Title= MWHS-SWMM Export to HEC-RAS


River Reach= CHO

Type RM Length L Ch R = 1 ,5.065 ,471.716902,515.260000,471.716902

BEGIN DESCRIPTION:

River Mile 5.065

END DESCRIPTION:

#Sta/Elev= 68

       0   214.4      11   213.9      39   212.3      41   211.8     141   209.6

     174   208.0     275   205.1     293   203.9     297   201.6     299   201.3

     307   199.9     313   200.8     316   202.1     329   203.4     329   205.4

     366   208.6     413   208.5     417   208.3     429   206.2     434   205.8

     441   203.4     447   206.3     449   206.4     488   208.1     502   208.1

     506   208.1     550   207.0     559   206.1     566   205.9     566   205.9

     575   205.8     585   206.7     587   206.6     624   205.9     638   206.0

     644   205.9     651   205.8     667   206.8     681   207.3     696   207.7

     723   207.8     724   207.8     739   207.5     763   208.1     787   209.1

     816   209.3     920   210.0     970   209.8     998   209.8    1055   209.8

    1076   209.5    1079   209.6    1097   209.9    1108   210.1    1130   210.4

    1225   210.6    1358   211.1    1372   211.1    1419   211.3    1426   210.6

    1443   211.4    1472   211.5    1647   211.5    1670   211.5    1745   211.7

    1796   212.2    1868   213.4    1888   214.2

#Mann= 3 , 1 , 0

       0     0.1       0     275    0.04       0     366    0.08       0

Bank Sta=274.500000,365.500000


Table 2.   The exported HEC-RAS Geometry File from InfoSWMM 

Read more…

Subject:  Advanced SWMM 5 import into InfoSWMM and H2OMAP SWMM


The current version of InfoSWMM and H2OMAP SWMM not only imports the latest SWMM 5 version but it has built in flexibility that allows the user to import selected data sections, model data sections or auxiliary file information such as calibration data files.  This allows you the choice of importing non specific network data that can used in the model of any city, county, shire, town or watershed.  For example,  you can import only these sections without affecting the geometry of your network:


1.      Calibration File Information,

2.      RTC Rules

3.      Aquifers

4.      Snowpacks

5.      Buildup for Water Quality,

6.      Washoff for Water Quality,

7.      Evaporation,

8.      Time Series,

9.       DWF,

10.        Patterns,

11.        RDII

12.        Loadings,

13.        Curves,

14.        LID Controls,

15.        LID Usage,

16.        Pollutants,

17.        Land Uses


Possible uses of this feature would be to have a city wide or company wide library of LID controls, RTC Rules or RDII values.


Image002


Figure 1.  Import Dialog with Import Options


Image003


Figure 2.  Only names and directories of the Calibration Files was imported 


Read more…

Subject:   How to Compare the Output Manager Statistics in H2OMAP SWMM to the SWMM 5 Output Text File


The value of the total inflow in the text output file is the integrated total for the whole simulation including all time steps.   This is the total volume that is shown in Map Display for Nodes and Links or in the Summary Tables for Nodes and Links.   If you graph the flow or depths in Output Report Manager and use the Field Statistics tool it will only show you the statistics for the SAVED time steps.  However, if you multiply the Sum (Total) Value by the saved interval in seconds you will have another estimate of the total node of link  statistic.  For example, a Sum Total of L/s times seconds yields liters which divided by 1,000 yields ML. 


Image002


Figure 2.  Map Display of  the  total link volume in the model run comes from the Node Inflow Summary Table in the Text Report File


Image003


  ***********************

    Node Inflow Summary

  ***********************


  -------------------------------------------------------------------------------------

                                  Maximum  Maximum                  Lateral       Total

                                  Lateral    Total  Time of Max      Inflow      Inflow

                                   Inflow   Inflow   Occurrence      Volume      Volume

  Node                 Type           LPS      LPS  days hr:min    10^6 ltr    10^6 ltr

  -------------------------------------------------------------------------------------

  PN_060               JUNCTION      0.00     2.93     0  07:47       0.000       0.143


Read more…

Note:  Comparison of the H2OMAP SWMM Hazen Williams Force Main Solution to a Steady State HW Solution

In this example, we compare the force main head loss in four links in H20Map SWMM to the head loss in a steady state Hazen Williams solution for the same length pipe, diameter and flow (Figure 1).  The H2OMap SWMM model has a large constant dry weather inflow at the wet wells which floods the wet well and causes a constant pump flow to the force main (Figure 2).  The HW calculator is located here http://www.engineeringtoolbox.com/william-hazens-equation-d_645.html and a comparison for HW head loss in PSI for 5000 feet long, 3 inch diameter pipes with HW Coefficients of 130, 120, 110 and 100, respectively, is shown in Table 1.   The SWMM 5 equation loss (PSI Diff) and the PSI loss from the HW calculator are very close for all four links. 


Table 1.  Steady State comparison between HW Calculator and H2OMAP SWMM/SWMM 5 Force Main calculations.


HW

SWMM5

SWMM5

SWMM5 Loss

Loss 

Coefficient

Psi UP

PSI Dn

PSI Diff

PSI HW Calculator

130

84.563

44.88

39.683

39.82

120

88.772

43.765

45.007

45.16

110

91.798

41.426

50.372

50.54

100

95.354

38.727

56.627

56.82


Figure 1.   H2OMAP SWMM Wet Well, Pump, Force Main and Gravity Main Network.


Image002

Figure 2.  Constant Pump Flows


Image003

Read more…

Hello Members,

Though not a common practice in drainage systems, I was trying to simulate a "closed" or "shut off" pressurized conduit in SWMM5 to see the effect it would have to the performance of the whole system.

I am using an ORIFICE whereby a discharge coefficient of "0" represents a closed ORIFICE hence a closed (no fluid passing through) conduit and discharge coefficient of "1" to represent an open ORIFICE hence an open (fluid passing through) conduit.

This seems to work for a small non-looped network but when I try to apply it to a bigger network the results look not to reflect reality.

Could anyone out there be having an idea how I can do this since SWMM has no Valve objects to close and open a conduit?

Read more…

Waterfalls from Buzzfeed

Waterfalls from Buzzfeed  http://www.buzzfeed.com/fjelstud/waterfall-porn


1. Castle Waterfall, France

Castle Waterfall, France

2. Rainbow Springs, Florida

Rainbow Springs, Florida

3. South Africa

South Africa

4. Goðafoss, Iceland

Goðafoss, Iceland
Via: xflo.net

5. Chirapunchi Waterfalls, India

Chirapunchi Waterfalls, India

6. Off the Franz Josef Glacier, New Zealand

Off the Franz Josef Glacier, New Zealand
Via: timboss81

7. Hamilton Pool, Texas

Hamilton Pool, Texas

8. Baatara Gorge, Lebanon

Baatara Gorge, Lebanon

9. Cataratas del Iguazu, Argentina

Cataratas del Iguazu, Argentina

10. Yellowstone Falls, Wyoming

Yellowstone Falls, Wyoming

11. Bathurst Inlet, Nunavut, Canada

Bathurst Inlet, Nunavut, Canada

12. Boulder River Trail, Washington

Boulder River Trail, Washington
Via: capnsurly

13. (Behind the) Seljalandsfoss Waterfall, Iceland

(Behind the) Seljalandsfoss Waterfall, Iceland
Via: icesebra

14. Kauai, Hawaii

Kauai, Hawaii

15. The Catskills, New York

The Catskills, New York
Via: ahmerinam

16. Tiu Kelep Waterfalls, Indonesia

Tiu Kelep Waterfalls, Indonesia
Via: hhsp

17. Hawes, North Yorkshire, England

Hawes, North Yorkshire, England
Via: zacerin

18. Katarraktis, Greece

Katarraktis, Greece
Via: dkilim

19. Matthiessen Waterfall, Illinois

Matthiessen Waterfall, Illinois
Via: chrisgill

20. Badger Dingle, Shropshire, England

Badger Dingle, Shropshire, England
Via: jakeperks

21. Dettifoss Waterfall, Iceland

Dettifoss Waterfall, Iceland

22. Cataratas del Iguazu, Argentina

Cataratas del Iguazu, Argentina
Via: rominita

23. Haifoss Waterfall, Iceland

Haifoss Waterfall, Iceland
Via: 19650609

24. Golden Waterfall, Taiwan

Golden Waterfall, Taiwan
Via: jasonpan

25. Welsh Grey Park Waterfall, Canada

Welsh Grey Park Waterfall, Canada

26. Hocking Hills, Ohio

Hocking Hills, Ohio


Read more…

Innovyze Debuts 64-Bit H2ONET V10 for AutoCAD 2012

10th Release Provides Unrivaled High-Performance CAD Modeling and Simulation Capabilities for Large Networks

Broomfield, Colorado USA, November 15, 2011 — Redrawing the boundaries of innovation in the waterworks industry, Innovyze, a leading global innovator of business analytics software and technologies for wet infrastructure, today released its 64-bit version of H2ONET for AutoCAD® 2012 (Autodesk, San Rafael, CA), enabling engineers to work more efficiently than ever with very large network models.

H2ONET V10 marks the most significant milestone to date in the evolution of the company’s flagship product, an industry standard for comprehensive water distribution engineering and a premier choice for major ENR design firms and large water utilities around the world. With 64-bit functionality, the new release brings a new level of software and computational power to network modeling. It can now access hundreds of times more memory than was possible on a 32-bit operating system. More available memory can result in greater efficiency and significantly faster simulation runs and graphical displays of results when analyzing large water supply and distribution network models.

Built atop AutoCAD®, the world’s leading CAD platform, H2ONET delivers breakthrough performance in integrated real-time network modeling, GIS data exchange, spatial database query and analysis across multiple data types, and the sophisticated mapping required for complete infrastructure (asset) management and business planning. Its pioneering functionality and state-of-the-art computational algorithms allow engineering professionals to directly access CAD and GIS datasets, extract pertinent modeling information, and automatically construct, skeletonize, load, calibrate, analyze, design, operate and optimize any network model — saving time and money across the enterprise. Such capabilities can greatly assist water utilities in complying with drinking water quality regulations, understanding and controlling taste and odor problems, developing cost-effective energy solutions for water system operations, improving system reliability and integrity, optimizing capital improvement and rehabilitation programs, enhancing community relations, and planning sound security measures.

“Our priorities have always been to advance the frontiers of modeling technology and support our customers’ successes by making them more productive and competitive,” said Paul F. Boulos, Ph.D., BCEEM, Hon.D.WRE, F.ASCE, President and Chief Operating Officer of Innovyze. “Supporting AutoCAD 2012 and 64-bit functionality, H2ONET V10 delivers on our promise to equip customers with the ultimate decision support tool for water distribution systems. It is once again setting the standard for quality and high-performance water network modeling and management with unrivaled power, cutting edge capabilities, rich functionality, and ease of use. From top to bottom, this release is designed to enable world-record modeling performance — allowing our users to increase productivity and quality while achieving their engineering and business goals.”

Pricing and Availability
Upgrade to H2ONET V10 is now available worldwide by subscription. Subscription members can immediately download the new version free of charge directly from www.innovyze.com. The Innovyze Subscription Program is a friendly customer support and software maintenance program that ensures the longevity and usefulness of Innovyze products. It gives subscribers instant access to new functionality as it is developed, along with automatic software updates and upgrades. For the latest information on the Innovyze Subscription Program, visit www.innovyze.com or contact your local Innovyze Channel Partner.

Read more…
Subject:  Qfull in SWMM 5 for various levels of y/yFull in a Circular Pipe


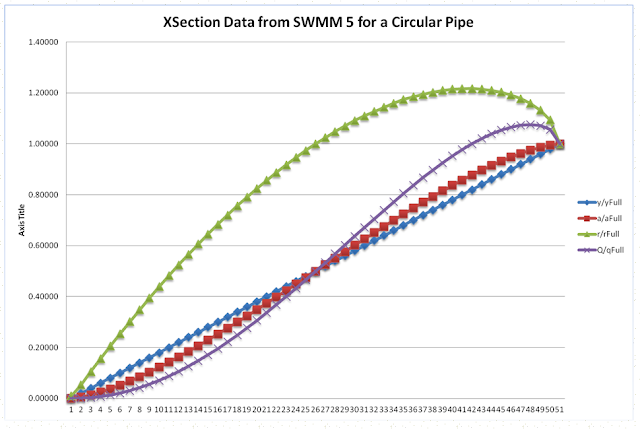
Here is a table that shows the value of Q/Qfull for various levels of y/yFull or d/D in SWMM5.  The full flow if you loop off the top of a circular pipe at the 0.83 level would be about 1.01 times Qfull for the whole pipe.  Figure 1 shows how the flows are calculated at various values, Table 1 and Figure 2 show the values of a/aFull, r/rFull and q/qFull for various values of y/yFull.


Figure 1.   How Qfull and Qmax are calculated in  SWMM 5 based on the roughness, slope and a lookup table for area and hydraulic radius for a circular pipe.


Image004


Table 1.   Table  of y/yFull and Q/Qfull based on a/aFull and r/rFull

y/yFull
a/aFull
r/rFull
Q/qFull
0.00000
0.00000
0.01000
0.00000
0.02000
0.00471
0.05280
0.00066
0.04000
0.01340
0.10480
0.00298
0.06000
0.02445
0.15560
0.00707
0.08000
0.03740
0.20520
0.01301
0.10000
0.05208
0.25400
0.02089
0.12000
0.06800
0.30160
0.03058
0.14000
0.08505
0.34840
0.04211
0.16000
0.10330
0.39440
0.05556
0.18000
0.12236
0.43880
0.07066
0.20000
0.14230
0.48240
0.08753
0.22000
0.16310
0.52480
0.10612
0.24000
0.18450
0.56640
0.12630
0.26000
0.20665
0.60640
0.14805
0.28000
0.22920
0.64560
0.17121
0.30000
0.25236
0.68360
0.19583
0.32000
0.27590
0.72040
0.22172
0.34000
0.29985
0.75640
0.24893
0.36000
0.32420
0.79120
0.27733
0.38000
0.34874
0.82440
0.30662
0.40000
0.37360
0.85680
0.33702
0.42000
0.39878
0.88800
0.36842
0.44000
0.42370
0.91760
0.40009

Figure 2.   Graph of values in Table 1
Read more…

Subject:   How is the Mass Balance Calculated in the SWMM 5 Groundwater Component?


The groundwater component of SWMM 5 is found in the gwater.c code.  It (as is all of SWMM 5) is excellently written in small functions by Lew Rossman of the EPA during the SWMM 5 development process.  However, code being code sometimes it is easier to see how the code is functioning.  This blog or note tries to show the mass balance local function updateMassBal


The groundwater component consists of groundwater data (gw in the equation) and aquifer data (a) in the equation.  The equation for the groundwater mass balance is shown in Figure 1.   The infiltration, evaporation occur only over the pervious area but the percolation out the bottom of the aquifer occurs over the whole Subcatchment.


Figure 1.  Groundwater Mass Balance


Image003 


Read more…

Subject:   How is the Volume Calculated in the SWMM 5 Groundwater Component?


The groundwater component of SWMM 5 is found in the gwater.c code.  It (as is all of SWMM 5) is excellently written in small functions by Lew Rossman of the EPA during the SWMM 5 development process.  However, code being code sometimes it is easier to see how the code is functioning.  This blog or note tries to show that function. 


The groundwater component consists of groundwater data (gw in the equation) and aquifer data (a) in the equation.  The equation for the groundwater volume is shown in Figure 1.   The volume is the water content (theta) times the upper depth and the porosity of the aquifer times the lower depth (Figure 2).


Figure 1.  Groundwater Volume Calculations


Image004


Figure 2.  Lower and Upper Depth of the Groundwater Compartrment


Image007


Read more…

Aquifer and Groundwater Objects in SWMM 5

Subject:   Aquifer and Groundwater Objects in SWMM 5


There are two types of data objects in SWMM 5 to describe the Groundwater flow component.  There is a Groundwater data object associated with a Subcatchment that describes flow equations, the interaction between the Subcatchment infiltration and the Groundwater component and an Aquifer data object that describes the characteristics of the Aquifer that may span one or more Subcatchments.  The Groundwater data is specific to one Subcatchment but the Aquifer may extend over more than one Subcatchment.


Image007

Image003


Read more…

Subject: Hierarchy of Your Network in InfoSWMM and H2OMAP SWMM

In both InfoSWMM and H2OMAP SWMM you can run a subset of the network by using the Facility Manager to make part of the network inactive and not solved.  You can make the output files smaller if you are performing a continuous simulation and save only the results of All, the Domain Only or a Selection Set to the graphical output file (Figure 1).   Figure 2 shows a few ways to query, view, graph and perform statistics for the model run.

Figure 1.  Options for saving the Active Network Data to the Graphical Output Data Set.

Figure 2.  Output View, Query and Graphical Options.

Read more…

Subject:  Advanced SWMM 5 import into InfoSWMM and H2OMAP SWMM

The current version of InfoSWMM and H2OMAP SWMM not only imports the latest SWMM 5 version but it has built in flexibility that allows the user to import selected data sections, model data sections or auxiliary file information such as calibration data files.  This allows you the choice of importing nonspecific network data that can used in the model of any city, county, shire, town or watershed.  For example,  you can import only these sections without affecting the geometry of your network:


1.      Calibration File Information,
2.      RTC Rules
3.      Aquifers
4.      Snowpacks
5.      Buildup for Water Quality,
6.      Washoff for Water Quality,
7.      Evaporation,
8.      Time Series,
9.       DWF,
10.        Patterns,
11.        RDII
12.        Loadings,
13.        Curves,
14.        LID Controls,
15.        LID Usage,
16.        Pollutants,
17.        Land Uses


Possible uses of this feature would be to have a city wide or companywide library of LID controls, RTC Rules or RDII values.


Figure 1.  Import Dialog with Import Options
Figure 2.  Only names and directories of the Calibration Files was imported


Subject:   Import of Sections from SWMM 5 into InfoSWMM and H2oMAP SWMM

A very useful hidden feature of the import SWMM 5 to InfoSWMM and H2OMAP SWMM is the ability to import all of the data or just one section.  For example, you can import the LID data, DWF patterns, control rules, pollutants, transects and other data that is transferable between different networks.

 
Read more…

Allegheny sewer project at estimated $6 billion

Photos
click to enlarge

Barney Oursler 
Sidney Davis | Tribune-Review


About the writer

Bob Bauder is a Pittsburgh Tribune-Review staff writer and can be reached at 412-765-2312 or via e-mail.

The Allegheny County Sanitary Authority is poised to begin what it calls the region's largest and most expensive public works project to keep raw sewage out of the three rivers, but an environmental coalition wants a bigger investment in green technology, which members say would increase jobs and beautify communities.

One option ALCOSAN is studying is to place mammoth holding tunnels under the rivers from Emsworth to Etna and Braddock that would store sewage overflow in heavy weather and release it when treatment plants could handle it.

"The storage tunnels appear to be the top option," ALCOSAN spokeswoman Nancy Barylak said. "That's the technology that's getting the most attention in terms of viability and cost-effectiveness."

ALCOSAN and the 83 communities linked to its Woods Run treatment plant must upgrade their respective sewer systems under federal and state mandates that call for heavy fines if they fail to drastically reduce an estimated 8 billion gallons of untreated sewage dumped into rivers each year during heavy rainstorms.

The improvements, originally estimated to cost $3 billion, now range from $4 billion to $6 billion, said Barylak, who attributed the increase to authority and municipal officials having a better understanding of the scope of work and its costs.

Residents would pay that bill through increased sewer rates. In cities under similar government orders, bills have doubled and continue to climb.

"The public really needs to learn about this," Barylak said. "There's no pot of gold at the end of this sewage rainbow -- it's the ratepayer, and we're taking that very seriously."

ALCOSAN and communities are planning to install bigger pipes, Barylak and municipal officials said. ALCOSAN would enlarge the capacity of its Woods Run treatment plant from 250 million gallons of sewage daily to 600 million gallons. It would add satellite treatment plants and install the holding tanks. ALCOSAN hosted a public meeting on Wednesday at the IBEW hall in the South Side to outline its proposals.

"Why not look to green solutions to these problems?" the Rev. David Herndon, pastor of the First Unitarian Church in Shadyside, said during a coalition news conference preceding the public meeting. "Just as Pittsburgh was a leader in reducing air pollution in the 1940s, maybe we can be a leader in green sewage infrastructure."

Clean Rivers, the newly formed coalition of environmental groups, urged ALCOSAN and communities to consider using more green technology, such as natural drainage systems to resolve overflows.

"We would like to build public support for ALCOSAN to negotiate issues of creating the most jobs and the most benefits that would come from green infrastructure that would reduce the stormwater flow and would also make our communities more livable," said Barney Oursler, executive director of coalition member Pittsburgh United.

In Pittsburgh and its suburbs, sewer lines installed years ago often double as storm sewers, allowing untreated sewage to flow into rivers when rain overwhelms the systems. Clean water laws enacted in the 1970s no longer permit that.

Communities must submit correction plans to regulatory agencies by 2013 and have them in place by 2026.

Raw sewage threatens drinking water supplies and aquatic life and hampers recreational use of the Ohio, Allegheny and Monongahela rivers.

"It's a real threat when overflows happen from the sewage collection systems ... both a public health threat as well as an aesthetic problem," said Jon Capacasa, director of the Water Protection Division at EPA's Region 3 office in Philadelphia.

Cincinnati last year embarked on a sewer system upgrade costing an estimated $3.2 billion. Sewer rates, about $55.25 per month for average users in 2011, increased by 90 percent since 2004 and are expected to rise 8 percent next year, the Cincinnati Enquirer reported.

St. Louis recently agreed to spend $4.7 billion over 20 years to satisfy EPA regulations, and officials there anticipate sewer rates will double over four years from the $28.85 average monthly payment, according to the Post-Dispatch.


Read more: Allegheny sewer project at estimated $6 billion - Pittsburgh Tribune-Reviewhttp://www.pittsburghlive.com/x/pittsburghtrib/news/pittsburgh/s_766564.html#ixzz1dKkkS8Kw


Read more…

Subject:   SWMM 5 Loss Term Values for various velocities and K values


SWMM 5 has three loss terms available for each link:  Entrance, Exit and Other losses.  The Entrance loss uses the upstream link velocity, the  Other loss uses the center link velocity and the Exit loss uses the downstream link velocity.  The general form of the loss term in the St. Venant equation is K*V^2/2g Table 1 shows the loss in feet of head for various combinations of velocity and K value.  If you want to  simulate a little loss of head at each node then a small value of K should be used otherwise the cumulative loss in the whole networks will be many feet of head.


  Loss Term units equals K * V^2/2g = ft/sec * ft/sec * sec^2/ft = ft


Table 1:  Loss in feet of head for various combinations of velocity and K values.


Velocity (ft/sec)

K

K

K

K

K

K

0.050

0.100

0.250

0.500

0.750

1.000

1

0.001

0.002

0.004

0.008

0.012

0.016

2

0.003

0.006

0.016

0.031

0.047

0.062

3

0.007

0.014

0.035

0.070

0.105

0.140

4

0.012

0.025

0.062

0.124

0.186

0.248

5

0.019

0.039

0.097

0.194

0.291

0.388

6

0.028

0.056

0.140

0.280

0.419

0.559

7

0.038

0.076

0.190

0.380

0.571

0.761

8

0.050

0.099

0.248

0.497

0.745

0.994

8

0.050

0.099

0.248

0.497

0.745

0.994

9

0.063

0.126

0.314

0.629

0.943

1.258

10

0.078

0.155

0.388

0.776

1.165

1.553


Read more…

Kentucky’s Largest Wastewater Utility Chooses InfoWorks ICM 

Louisville and Jefferson County Metropolitan Sewer District Looks to InfoWorks ICM for Modeling its Complex Combined Sewer System


Broomfield, Colorado USA, November 8, 2011 — Innovyze, a leading global innovator of business analytics software and technologies for wet infrastructure, today announced that Kentucky’s largest municipal wastewater utility, the Louisville and Jefferson County Metropolitan Sewer District (MSD), has selected InfoWorks ICM to fulfill its sewerage and drainage modeling requirements within its combined sewer system. The purchase will give the utility access to the most advanced and comprehensive collection system modeling and management application in the industry.

MSD is responsible for a wastewater collection, stormwater drainage and flood protection system that serves almost three quarters of a million people. Established in 1946, it manages over 3,200 miles (4,800 km) of combined and sanitary sewer pipe, six regional wastewater treatment facilities, 14 small treatment plants, 285 sewage pump stations and 16 major flood pumping stations, and maintains more than 790 miles (1,300 km) of streams. “Our system is large and complex, and planning accurately for new infrastructure to achieve overflow reduction and flood relief can be difficult,” says Justin Gray, a Senior Engineer at MSD. “We are continually seeking out the best technology, and InfoWorks ICM gives us the most powerful option for planning and analyzing the surface and subsurface interactions that are inherent with a combined stormwater and sanitary sewer system. This modeling platform enables us to integrate a surface grid over the sewer system, our 29-mile flood protection system, as well as the Ohio River and Beargrass Creek systems, which can heavily influence the function of the combined system.”

InfoWorks ICM breaks new ground by enabling integrated catchment modeling on a platform that incorporates both urban and river catchments. Full integration of 1D and 2D hydrodynamic modeling techniques enables users to model the above- and below-ground elements of these catchments with unique flexibility and detail. Such advanced capabilities greatly enhance the ability of wastewater utilities to predict flood risks; support cost-effective drainage design and management; develop online urban flooding forecasts; conceive and evaluate sound and reliable urban catchment strategies such as storm sewer separation, active real-time control and provision of adequate additional storage; and improve the operation of any drainage system.

A sophisticated tool for importing, tracking and auditing large amounts of highly complex data, InfoWorks ICMallows the development of cost-effective, innovative solutions to engineering challenges as well as a complete understanding of the processes involved. Multiple simulations can be scheduled across a pool of workstations with results returned to a single location, making for highly effective use of computing resources.

“The Innovyze family of sewer network modeling and management products continues to evolve with the ever-changing needs of our customers,” said Americas Operations Director J. Erick Heath, P.E. “Louisville and Jefferson County MSD is one of the most prominent wastewater service providers in North America, and their selection of InfoWorks ICM helps demonstrate the continued fast-paced adoption of this vanguard application by utilities around the globe.”


Read more…