|
Call for Papers Announced for 2012 Asia Pacific Water and Sewer Systems Modeling Conference Major Industry Event to Unite Global Modeling Experts August 21-22, 2012, at Gold Coast, Australia |
|||||
|
|
|||||
|
Broomfield, Colorado USA, January 10, 2012 — Innovyze, a leading global innovator of wet infrastructure modeling and simulation software and technologies, today announced the opening of registration and a call for papers for the fifth annual Asia Pacific Water and Sewer Systems Modeling Conference. The event, widely considered to be the most comprehensive and significant wet infrastructure modeling, design and management technology conference of its kind, will be held from August 21-22, 2012, at the Holiday Inn, Surfers Paradise on Australia’s Gold Coast. This once-a-year learning opportunity is sponsored by major water utilities and associations in the region. It will feature keynote presentations from leaders in hydraulic and water quality modeling throughout Asia, Europe, North America, Australia and New Zealand. The conference also incorporates an annual gathering of Innovyze software users and their managers who want to sharpen their skills, expand their knowledge, and share best practices with their peers. The ultimate goals are to design, operate and manage better systems; protect the environment; and safeguard public health. The forum will allow water, wastewater and stormwater professionals to explore new ways of using engineering GIS technology, advanced network modeling and simulation, and asset management applications. Participants will learn how they can leverage these tools to do their jobs better, easier, faster and more efficiently; maximize their return on software investments; and make their organizations more globally competitive. They will also earn valuable Chartered Professionals Continued Professional Development (CPD) hours. “Potable water and sanitary sewer systems are essential for a healthy and vibrant community,” notes Paul Banfield, Business Development Manager for Innovyze and chairman of the conference organizing committee. “Proper management of water and wastewater assets plays a critical role in the provision of these vital services. This leading wet infrastructure focused conference is both fun and educational. I am confident that attendees will come away better positioned to provide their communities with reliable and cost-effective safe drinking water and sanitary sewer systems.” To supplement the keynote presenters and speakers already confirmed, the organizing committee is seeking relevant and unique presentations. Key topics include:
The agenda will also feature hands-on software demonstrations, discussions of business implementation and management issues, industry solutions presentations, key technology updates, and social and networking events. Keynote speaker Paul F. Boulos, Ph.D., BCEEM, Hon.D.WRE, F.ASCE, President and Chief Operating Officer of Innovyze, will address the conference on the latest technologies in water, stormwater, and wastewater network modeling, capital planning and asset management. “This exceptionally fun and educational event is always guaranteed to energize and inspire,” said Boulos. “It provides a wonderful forum for sharing best practices and exploring the state of the art in water/wastewater infrastructure engineering, design and management solutions designed to help solve everyday challenges and problems. Attendees can carry this valuable knowledge back to their organizations, opening new avenues for increasing productivity and performance, enhancing project quality, maximizing return on their software investments, gaining a competitive edge on the future, advancing their careers, and improving the quality of life in their communities. They’ll leave restored, energized, and better prepared to accomplish great things. They’ll also play a significant a role in the future of Innovyze and our products, inspiring us and pushing us to build great products, a great company, and a great community.” Abstract Submission |
All Posts (522)
Sort by
In SWMM 5 only the Kinematic Wave solution allows a flow divider at a node to divide the Inflow to node to two downstream links, but you can use the Inflow/Outflow Outlet type in InfoSWMM to divide the inflow based on a Inflow/Outflow Diversion Table (Figure 1). For example, in InfoSWMM it is possible to have two downstream links from a Node that are Outlet types Inflow/Outflow so that the low flow goes down one link and the high flow goes down the other link (Figure 2 and Figure 3). The low flow and the high flow link use different diversion tables in which the tables are constructed so that the flow is positive in one link and zero in the other to a dividing flow value and then zero and positive for the same two links after the dividing flow value ( 5 cfs in the example).
Figure 1. Types of OUTLETS in InfoSWMM and SWMM 5

Figure 2. Example low flow and high flow Outlet Links to divide the total inflow at the upstream node at 5 cfs.

Figure 3. The flow is divided into the low and high flow links at the dividing flow of 5 cfs.

Stormwater management is a growing concern in many communities as more and more natural areas are covered with impervious surfaces. This leads to more stormwater runoff and more potential for pollutants of all kinds to make their way into our water supply.
There are a lot of sources for stormwater pollution in even the smallest communities. Parking lots, driveways, streets, buildings, construction sites, and failed sewer systems all pose some kind of threat the quality of our water. Debris, litter, oils, grease, fertilizer, pesticides, and much, much more can build up in these locations, just waiting for the next storm to wash them into the nearest river or other body of water. Our stormwater management systems were designed to cope with a lot of this, but there are some simple things the entire community can do to make the process more effective.
- Involve and educate the community – Before anyone starts doing their bit to manage stormwater, they are going to need a reason. Find ways to help everyone in the neighborhood understand why these tips are important.
- Don’t dump anything in storm drains – Whether it’s just small pieces of litter or bits of plant matter, anything could start to clog up the system. Always dispose of your garbage properly.
- Choose non-toxic products – The less you use toxic chemicals (on your home, car, or lawn) the less we will see harmful substances getting into our water.
- Conserve and recycle – There are many reasons to be more conservative in our use of materials, and there are always opportunities to recycle, and in the case of stormwater management, this kind of behavior can have immediate benefits.
- Keep drains clear – If any litter or other debris is starting to build up near the stormwater drains, clean it away before the blockage renders the drains completely ineffectual.
- Check the septic system – Any leaks or other degradation to your system can have some pretty serious ramifications. As waste gets into the soil, rainwater can take it further until you have some real problems with the local water supply.
- Make cut backs – Too much chemical influence is never a good thing. Cut back on all the pesticides, herbicides, and fertilizers that you’ve been using on your lawn or garden. There’s a good chance you can still get great results with less of the chemical.
- Vehicle care – When you wash your car or change the oil, make sure that the runoff or any spill over is properly handled. Wash your car on the lawn or in a commercial facility, and always make sure that the oils is disposed of or recycled.
- Reduce paved areas – This isn’t something you can do over the weekend, but if you are looking at new landscaping or you’re remodeling your house, look at ways you can open the area to the rain and reduce the impermeable areas.
- Sweep, don’t hose – When you are cleaning off your driveway or sidewalk, take the time to sweep up the debris and dispose of it properly. Don’t just hose all that dirt, oil, and grease into the grass.
Polluted runoff is a real threat to the quality of our clean water, and while many of us don’t give a second thought to where the water from the last storm will end up, it’s a problem we can’t ignore. These tips are a simple way to get started and involve more people in the efforts to keep our water clean.
CDM and Wilbur Smith Associates Proudly Serving Clients as CDM Smith
New brand reflects emergence of a full service global leader
January 01, 2012
CAMBRIDGE, Massachusetts—What began in February 2011 with joining of two industry forces has culminated in a fully integrated provider of comprehensive water, environment, transportation, energy and facilities services united under the new brand CDM Smith.
According to Chief Executive Officer Richard D. Fox, “CDM Smith brings together CDM and Wilbur Smith Associates, two firms of rich heritage and world-wide reputation. With 123 years of combined cross-discipline expertise, our people bring a wealth of knowledge, experience and dedication to every client relationship and each project. While our name is different and our portfolio of services has expanded, we remain committed to doing what is right for our clients, our communities, each other and the future.”
Proving to be better together, CDM Smith represents almost 6000 employees excelling in 100 technical specialties, partnering with clients to solve challenges in 28 countries around the world.
CDM Smith provides lasting and integrated solutions in water, environment, transportation, energy and facilities to public and private clients worldwide. As a full-service consulting, engineering, construction, and operations firm, we deliver exceptional client service, quality results and enduring value across the entire project life cycle.
|
Innovyze Launches 2012 Technical Webinar Series Registration Open for Ten-Session Series Led by Innovyze Engineers, Launching February 7, 2012 |
|||||
|
|
|||||
|
Broomfield, Colorado USA, January 3, 2011 — Innovyze, a leading global innovator of business analytics software and technologies for wet infrastructure, today announced the dates for its 2012 Technical Webinar series. The ten-session event begins February 7, 2012, and continues through June 2012. Each session is open to utilities and their consultants. Admission is free, but pre-registration is required. To register, visit http://www.innovyze.com/education/webinars. “Our customers are continuously looking for cost-effective ways to grow their knowledge bases and learn about emerging technologies,” said Paul F. Boulos, Ph.D., BCEEM, Hon.D.WRE, F.ASCE, President and COO of Innovyze. “Each of these important webinars will be led by a technical engineering expert. The sessions will cover a wide range of key wet infrastructure topics, from capital planning and carbon footprint analysis to flood modeling, advanced water quality and real time modeling, and advanced business analytics applications. We anticipate these unique offerings to draw record attendance.” Webinar Schedule Risk-based Prioritization of Sewer Rehabilitation with CapPlan Sewer Real Time Water Distribution Forecasting and Response with IWLive Modeling the Integrated Collection System from Rivers to Pipes with InfoWorks ICM Using Hydraulic Models for Energy Management and Carbon Footprint Reduction Advanced Business Analytics for Sewer Systems Inside ArcGIS, Featuring InfoMaster Modeling Two-Dimensional Overland Flow with InfoSWMM 2D Risk-based Prioritization of Water Main Replacement featuring CapPlan Water Modeling and Eliminating Transients in Water Distribution Systems with InfoSurge Designing and Implementing a Unidirectional Flushing Program in Record time with InfoWater UDF Monitoring a Distribution System for Contamination Events |
Your network data usually has a number of different attributes that describe the features it represents (Figure 3). While you’ll commonly use one of the attributes to symbolize the
data—for example, showing one quantity in the InfoSWMM Map Display —you may sometimes want to use more than one. One way to show multiple attributes in InfoSWMM is to copy layers and then use the Layer Properties to color, map or otherwise display the multivariable data (Figure 1). For example, Figure 2 shows the important Subcatchment parameters of Slope, Imperviousness and Width as graduated colors, dots and a pie shape, respectively.
Figure 1. Use the Symbology Tab to select the attribute you want to show and the way to show the attribute.

Figure 2. The Subcatchment slope is shown in graduated colors, the percent impervious in scattered dots a a measels map and the Subcatchment Width is shown in a pie graph with the size of the pie a function of the total width.

Figure 3. Physical Data Estimated from a DEM using the Subcatchment Manager in InfoSWMM.

The Subcatchment Manager of InfoSWMM will help calculate most of the physical parameters associated with a Watershed or Subcatchment in SWMM 5 from a Digital Elevation Data (Step 1). The Subcatchments slope is estimated from a slope raster (Step 2) and the Slope Calculator (Step 4). The created watershed area are calculated using the command Update DB from Map (Step 6) along with the Subcatchment Width (Step 3) and the Impervious Area (Step 5). The physical parameters estimated from the DEM are shown in Figure 1.
Figure 1. Physical Data Estimated from a DEM using the Subcatchment Manager in InfoSWMM.

Step 1. Use the command Create Flow Stream to create a Flow Stream for the DTM or DEM that can be used later.

Step 2. Create a Slope Raster from the DEM for later usage in the Slope Calculator.

Step 3. Calculate the Width of the Subcatchment using one of five methods.

Step 4. Calculate the Slope in percent from the Slope Raster created in Step 2.

Step 5. Populate the Impervious area percentage using a Parcel shape file and the Created Subcatchments.

Step 6. Use Arc Map to calculate the area of the Subcatchments using the command Update DB from Map and the following Operation Flags.

The Subcatchment Manager of InfoSWMM will help calculate most of the physical parameters associated with a Watershed or Subcatchment in SWMM 5 from a Digital Elevation Data (Step 1). The Subcatchments area created from a Flow Direction Raster (Step 2) and a Flow Accumulation Raster (Step 4) after filling in any Sinks in the DEM (Step 3). The created watersheds (Step 5). The physical parameters estimated from the DEM are shown in Figure 1.
Figure 1. Physical Data Estimated from a DEM using the Subcatchment Manager in InfoSWMM.

Step 1. Find, Create or Otherwise Locate a TIN, DEM or DTM for the project area with elevation data that you can use with the InfoSWMM Subcatchment Manager.

Step 2. Create a Flow Direction Raster using the Watershed Command.

Step 3. Check to see if there are Sinks in the Elevation Data that have to be filled using the Filled Sink Command.

Step 4. Create a Flow Accumulation Raster

Step 5. Create the Watersheds from the Flow Direction and Flow Accumulation Rasters.

If you have a large network and especially if you are doing continuous simulation then you want to have many tools for helping you understand the network and the simulation results.
v In InfoSWMM and H2OMAP SWMM you can have a Base Network with many differenct Child Scenaio generations. A Child can be either based on the Base Scenario of a different generation Child Scenario.
v Facility Manager allows you to make inactive and active sets areas of your network, which makes simulating larger and smaller models a snap to do in InfoSWMM. Run Manager lets you control which areas of the model network gets save to the binary graphics file (Figure 1).
v The Process Control in Run Manager (similar to the process control in SWMM 5) allows the modeler to control which processes are simulation to help in her model calibration.
Figure 1. Scenarios, Facility Manager and Run Manger Options.

Figure 2. Run Manager Process Controls.

You can make tables of the node, link and Subcatchment output data in SWMM 5 if you use the DOS SWMM 5 program but not the Windows DLL. Step 1 is to create the DOS batch file, Step 2 is to select the nodes, links and subcatchments, Step 3 is to run the batch file and Step 4 is to view the RPT tables or extract the data to Excel. You can do this directly in the InfoSWMM and H2OMAP SWMM graphical user interfaces by using Run Manager, Step 5 to select the nodes, links and subcatchments and Step 6 to view the tables in the browser.
Step 1. Make a Batch File to call the DOS SWMM 5
swmm5.exe Example1.inp D:\swmm5.0.022\bob.rpt
pause
Step 2. Add the nodes, links and subcatchments tables you want to generate in the RPT file
[REPORT]
CONTROLS NO
LINKS ALL
NODES ALL
SUBCATCHMENTS ALL
Step 3. Run the Batch file

Step 4. Extract the Tables from the RPT File of SWMM 5
<<< Node 17 >>>
---------------------------------------------------------------------------------
Inflow Flooding Depth Head TSS Lead
Date Time CFS CFS feet feet MG/L UG/L
---------------------------------------------------------------------------------
JAN-01-1998 01:00:00 0.000 0.000 0.000 980.000 0.000 0.000
JAN-01-1998 02:00:00 5.910 0.000 0.608 980.608 26.065 5.213
JAN-01-1998 03:00:00 11.935 0.000 0.887 980.887 22.826 4.565
JAN-01-1998 04:00:00 18.291 0.000 1.143 981.143 21.176 4.235
JAN-01-1998 05:00:00 12.640 0.000 0.916 980.916 22.426 4.485
JAN-01-1998 06:00:00 3.925 0.000 0.493 980.493 27.578 5.516
JAN-01-1998 07:00:00 0.388 0.000 0.161 980.161 38.134 7.627
JAN-01-1998 08:00:00 0.067 0.000 0.071 980.071 26.937 5.387
JAN-01-1998 09:00:00 0.029 0.000 0.048 980.048 1.878 0.376
Step 5. InfoSWMM and H2OMAP SWMM dialog for selecting nodes, links and subcatchments for generating a detailed RPT file table.

Step 6. Sample InfoSWMM and H2OMAP SWMM RPT Tables if Report Options is used.

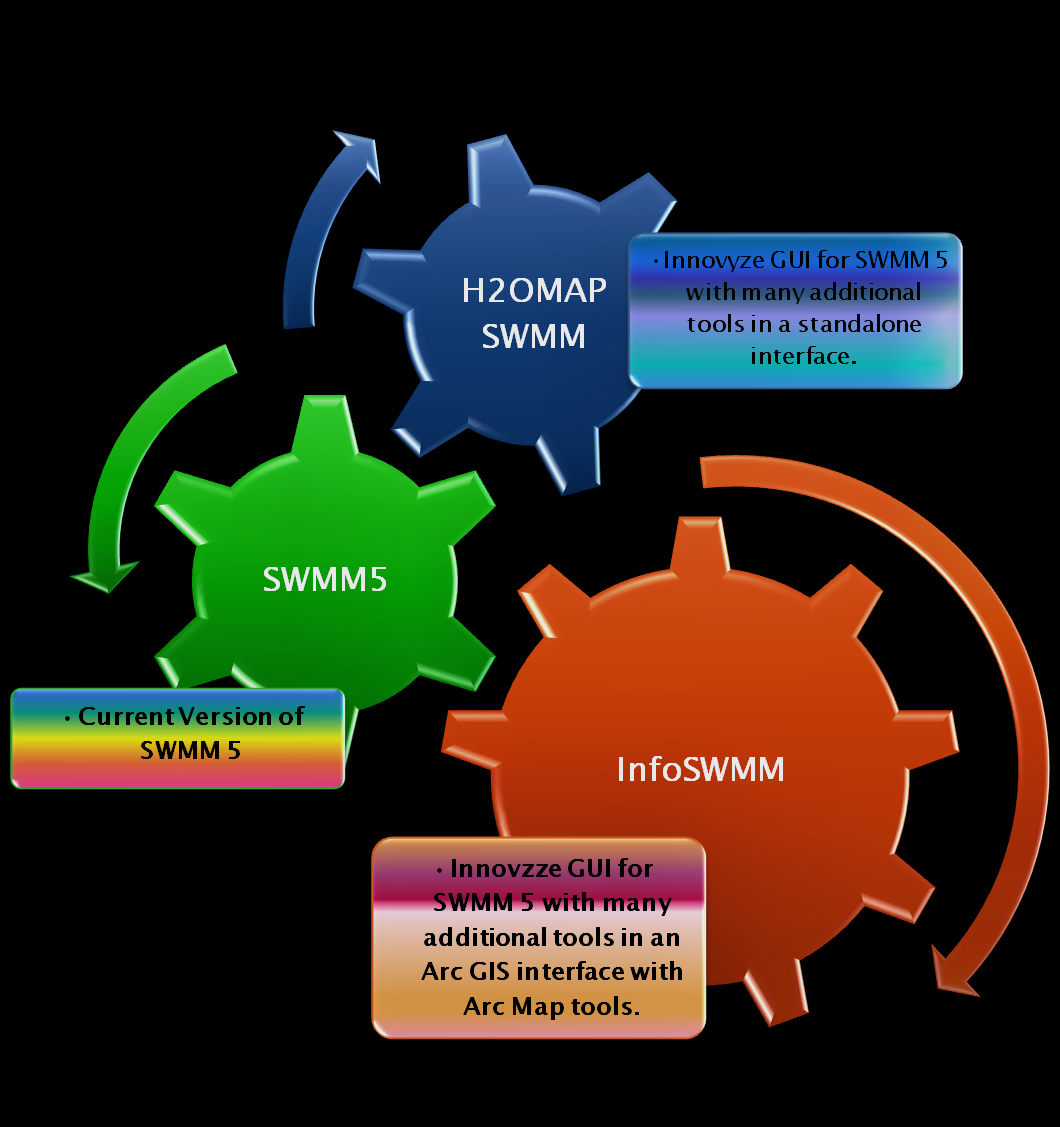
InfoSWMM and H2OMAP SWMM are different graphical user interfaces with similar tools to the current version of SWMM 5. They both use a C++ engine built around the C code engine of SWMM 5. Most of these blogs apply to SWMM 5, InfoSWMM and H2OMAP SWMM.
The RDII method in InfoSewer is similar to the RDII or RTK method in InfoSWMM with some differences. The RTK data for triangles 1, 2 and 3 are defined in the Unit Hydrograph but instead of individual R values, the overall R is set and the Percent R1, R2 and R3 are defined based on the total R. R3 is calculated internally as 100 – R1 – R2. Each loading manhole with RDII flow has a total area, a hyetograph and a Unit Hydrograph. The hyetograph has to be set at multiples of the unit hydrograph, so you can define the time or X columns with integers and then use the Block Edit command to change X to minutes by multiplying by the Unit Hydrograph time (Figure 1). You can use only one component if you set R1 or R2 to 100 percent or R3 to 100 percent by setting R1 and R2 to 0 percent (Figure 2). The overall area of the Unit Hydrograph is divided amongst the loading manhole using the Subbasin Area (Figure 3). The storm flows generated can be viewed using a Group Graph (Figure 4).
Figure 1. Hyetograph Curve for the RDII Unit Hydrograph

Figure 2. The Unit Hydrograph is defined for various values of R, R1, R2, T1, T2, T3, K1, K2 and K3.

Figure 3. The Unit Hydrograph and Hyetograph are tied to a particular loading manhole using a Subbasin Area.

Figure 4. The Unit Hydrographs that are generated can be viewed using a Group loading Manhole Graph. The R1, R2 and R3 have only one triangle.

The maximum flow limit for a link applies to the kinematic wave and the dynamic wave solution. The inflow to the link in the kinematic wave solution is limited (Figure 1) but the calculated link flow is limited in the dynamic wave solution after the link flow (Figure 2):
1. Is checked using the Culvert Inlet Equations (optional)
2. The normal flow equation is checked (internally optional depending on the Normal flow options) and
3. The Picard iteration solution under relaxation parameter (always 0.5) is applied (Figure 3).
Figure 1. Kinematic Wave Solution Limits the Inflow to the Link Maximum limit.

Figure 2. Dynamic Wave Solution link flow limit.

Figure 3. The Link flow in the dynamic wave solution has three checks at each iteration in a time step.

If the slope of a link is negative and the solution is dynamic wave then the following data will be switched in link.c in SWMM 5. All upstream data for the link is switched to the downstream end of the link and vice versa. The means that if the flow is from the original upstream node to the downstream node the flow will be negative in the output of SWMM 5.
Negative flow in SWMM 5 means:
1. The link has an adverse or negative slope,
2. The link has reverse flow if the link slope is positive.

|
Sacramento Area Sewer District Chooses InfoWorks ICM for Smart Water Network Modeling Large California Sewer Utility Looks to Innovyze Solution to Model Its Large, Complex Sewer System |
|||||
|
Broomfield, Colorado USA, December 20, 2011 — Innovyze, a leading global innovator of business analytics software and technologies for wet infrastructure, today announced that the Sacramento Area Sewer District (SASD), California, has selected InfoWorks ICM to meet its sewerage modeling requirements. The purchase will give SASD access to the most advanced and comprehensive collection system modeling and management applications in the industry. SASD provides local sewage collection service to more than one million people in the Sacramento region, including the unincorporated areas of Sacramento County; the cities of Citrus Heights, Rancho Cordova, and Elk Grove; and portions of the cities of Folsom and Sacramento. It manages 4,300 miles of sewer pipe and 104 pump stations. “Sacramento Area Sewer District is committed to continuous improvement of our system and rigorously monitors our system performance,” says Ligaya Kohagura, P.E., Senior Civil Engineer at SASD. “We have started using InfoWorks ICM within our Capacity Management and System Analysis Group because it provides the best mix of advanced hydraulics combined with cutting edge technology. The InfoWorks ICMsimulation server also means that we can run more modeling iterations as the calculations are farmed out to our data center, freeing up our modeler’s computers for other tasks. It’s a great breakthrough that has improved our productivity.” A hallmark of InfoWorks ICM is its dynamic integration of one-dimensional (1D) hydrodynamic simulation of flows in rivers, open channels and pipe networks and two-dimensional (2D) hydrodynamic simulation of surface flooding in the urban environment and river floodplain. This industry-leading software provides a powerful solution for simultaneously modeling below-ground and above-ground elements of catchments to accurately represent all flow paths and improve understanding of the processes occurring in the holistic environment. The software also takes into account interactions of natural and man-made environments and effectively simulates the water quality impact of polluting runoff and effluent from urban areas. Such advanced capabilities greatly enhance wastewater utilities’ ability to predict flood risks; support cost-effective drainage design and management; develop online urban flooding forecasts; conceive and evaluate sound and reliable urban catchment strategies such as storm sewer separation, active real-time control and provision of adequate additional storage; and improve the operation of any drainage system. A sophisticated tool for importing, tracking and auditing large amounts of highly complex data, InfoWorks ICMallows the development of cost-effective, innovative solutions to engineering challenges as well as a complete understanding of the processes involved. Multiple simulations can be scheduled across a pool of workstations with results returned to a single location, making for highly effective use of computing resources. |
Step 1. Make an Output Relate for the Conduit Summary Table using the Operation Tab in Attribute Browser.

Step 2: Using the GIS Gateway you can save q/Q and d/D to a shape file that can then be added to the Arc GIS Table of Contents

Step 3. You now have a Shape File for the value of q/Q or Flow over Full Flow. You can also use the Symbology Tab in Data Properties to color and/or make bar charts and bubble charts from the summary q/Q and d/D values during the simulation for each link.

can anyone tel me how to use SWMM 5 to produce flood hazard map with return period 10, 20 and 50 year..i had done frequency analysis for study area...but dunno how to generate in SWMM 5... thanks...
Large Italian Utility Chooses InfoWorks ICM for Advanced Hydraulic Modeling
Dolomiti Reti Turns to Innovyze Smart Water Network Modeling Solution to Optimize Business Performance
Broomfield, Colorado, USA, December 13, 2011
Innovyze, a leading global innovator of wet infrastructure modeling and simulation software and technologies, today announced that Italian multi-utility Dolomiti Reti has chosen InfoWorks ICM to fulfill its demanding sewerage and drainage system modeling requirements. The news underlines the solution’s rapid global adoption as a tool of choice for areas with challenging topographies and complex surface-subsurface system interactions.
Dolomiti Reti, a leading provider of integrated water cycle services, provides services to 81,000 customers in the 18 municipalities of Italy’s northerly Trentino region, mainly in and around the historic capital city of Trento. The company is a part of the Dolomiti Energia Group, which provides a comprehensive portfolio of utility services, ranging from power production to waste disposal. The Group is dedicated to achieving complete customer satisfaction through continuous improvements in the efficiency, effectiveness and economy of its services.
The city of Trento encompasses many suburbs of extremely varied geography and population concentrations, from large industrial areas in the Adige valley to tiny mountain villages in the neighboring Dolomites. “The area’s wastewater treatment systems experience characteristically extreme seasonal fluctuations in flows and loadings,” notes Matteo Frisinghelli, Dolomiti Reti’s General Manager of Water Services. “These factors, added to the complex and varied valley/mountain geography, make InfoWorks ICM’s fully-integrated 1D and 2D hydrodynamic simulation capabilities an ideal choice for the utility.”
Dolomiti Reti intends to use the industry leading integrated catchment modeling solution for cost-effective sewerage and drainage analysis throughout its varied catchments to help identify and resolve issues, optimize its networks, and undertake efficient and proactive forward planning. The software enables simultaneous modeling of below-ground and above-ground elements of catchments to accurately represent all flow paths and provide a holistic understanding of all the environmental processes taking place.
The sophisticated InfoWorks ICM database design enables Dolomiti Reti to import, track, audit and interpret large quantities of data more easily and quickly than ever before. The software’s comprehensive planning and assessment capabilities provide the cutting-edge solution the company requires to offer optimized, cost-effective services to its customers.
“We are delighted that one of Italy’s leading utilities has chosen InfoWorks ICM for its complex wastewater and stormwater modeling requirements,” said Andrew Brown, Director of International Operations for Innovyze. “This vanguard solution is being rapidly adopted by progressive utilities around the world that are seeking its ease of use, flexibility, functionality, and unsurpassed power to resolve a wide spectrum of multi-faceted above and below-ground issues.”


|
Engine Error Number |
Description |
|
ERROR 101: |
memory allocation error. |
|
ERROR 103: |
cannot solve KW equations for Link |
|
ERROR 105: |
cannot open ODE solver. |
|
ERROR 107: |
cannot compute a valid time step. |
|
ERROR 108: |
ambiguous outlet ID name for Subcatchment |
|
ERROR 109: |
invalid parameter values for Aquifer |
|
ERROR 110: |
ground elevation is below water table for Subcatchment |
|
ERROR 111: |
invalid length for Conduit |
|
ERROR 112: |
elevation drop exceeds length for Conduit |
|
ERROR 113: |
invalid roughness for Conduit |
|
ERROR 114: |
invalid number of barrels for Conduit |
|
ERROR 115: |
adverse slope for Conduit |
|
ERROR 117: |
no cross section defined for Link |
|
ERROR 119: |
invalid cross section for Link |
|
ERROR 121: |
missing or invalid pump curve assigned to Pump |
|
ERROR 131: |
the following links form cyclic loops in the drainage system: |
|
ERROR 133: |
Node %s has more than one outlet link. |
|
ERROR 134: |
Node %s has illegal DUMMY link connections. |
|
ERROR 135: |
Divider %s does not have two outlet links. |
|
ERROR 136: |
Divider %s has invalid diversion link. |
|
ERROR 137: |
Weir Divider %s has invalid parameters. |
|
ERROR 138: |
Node %s has initial depth greater than maximum depth. |
|
ERROR 139: |
Regulator %s is the outlet of a non-storage node. |
|
ERROR 141: |
Outfall %s has more than 1 inlet link or an outlet link. |
|
ERROR 143: |
Regulator %s has invalid cross-section shape. |
|
ERROR 145: |
Drainage system has no acceptable outlet nodes. |
|
ERROR 151: |
a Unit Hydrograph in set %s has invalid time base. |
|
ERROR 153: |
a Unit Hydrograph in set %s has invalid response ratios. |
|
ERROR 155: |
invalid sewer area for RDII at node |
|
ERROR 156: |
inconsistent data file name for Rain Gage |
|
ERROR 157: |
inconsistent rainfall format for Rain Gage |
|
ERROR 158: |
time series for Rain Gage %s is also used by another object. |
|
ERROR 159: |
recording interval greater than time series interval for Rain Gage |
|
ERROR 161: |
cyclic dependency in treatment functions at node |
|
ERROR 171: |
Curve %s has invalid or out of sequence data. |
|
ERROR 173: |
Time Series %s has its data out of sequence. |
|
ERROR 181: |
invalid Snow Melt Climatology parameters. |
|
ERROR 182: |
invalid parameters for Snow Pack |
|
ERROR 183: |
no type specified for LID |
|
ERROR 184: |
missing layer for LID |
|
ERROR 185: |
invalid parameter value for LID |
|
ERROR 186: |
invalid parameter value for LID placed in Subcatchment |
|
ERROR 187: |
LID area exceeds total area for Subcatchment |
|
ERROR 188: |
LID capture area exceeds total impervious area for Subcatchment |
|
ERROR 191: |
simulation start date comes after ending date. |
|
ERROR 193: |
report start date comes after ending date. |
|
ERROR 195: |
reporting time step or duration is less than routing time step. |
|
ERROR 200: |
one or more errors in input file. |
|
ERROR 201: |
too many characters in input line |
|
ERROR 203: |
too few items |
|
ERROR 205: |
invalid keyword %s |
|
ERROR 207: |
duplicate ID name %s |
|
ERROR 209: |
undefined object %s |
|
ERROR 211: |
invalid number %s |
|
ERROR 213: |
invalid date/time %s |
|
ERROR 217: |
control rule clause out of sequence |
|
ERROR 219: |
data provided for unidentified transect |
|
ERROR 221: |
transect station out of sequence |
|
ERROR 223: |
Transect %s has too few stations. |
|
ERROR 225: |
Transect %s has too many stations. |
|
ERROR 227: |
Transect %s has no Manning's N. |
|
ERROR 229: |
Transect %s has invalid overbank locations. |
|
ERROR 231: |
Transect %s has no depth. |
|
ERROR 233: |
invalid treatment function expression |
|
ERROR 301: |
files share same names. |
|
ERROR 303: |
cannot open input file. |
|
ERROR 305: |
cannot open report file. |
|
ERROR 307: |
cannot open binary results file. |
|
ERROR 309: |
error writing to binary results file. |
|
ERROR 311: |
error reading from binary results file. |
|
ERROR 313: |
cannot open scratch rainfall interface file. |
|
ERROR 315: |
cannot open rainfall interface file |
|
ERROR 317: |
cannot open rainfall data file |
|
ERROR 318: |
date out of sequence in rainfall data file |
|
ERROR 319: |
invalid format for rainfall interface file. |
|
ERROR 321: |
no data in rainfall interface file for gage |
|
ERROR 323: |
cannot open runoff interface file |
|
ERROR 325: |
incompatible data found in runoff interface file. |
|
ERROR 327: |
attempting to read beyond end of runoff interface file. |
|
ERROR 329: |
error in reading from runoff interface file. |
|
ERROR 330: |
hotstart interface files have same names. |
|
ERROR 331: |
cannot open hotstart interface file |
|
ERROR 333: |
incompatible data found in hotstart interface file. |
|
ERROR 335: |
error in reading from hotstart interface file. |
|
ERROR 336: |
no climate file specified for evaporation and/or wind speed. |
|
ERROR 337: |
cannot open climate file |
|
ERROR 338: |
error in reading from climate file |
|
ERROR 339: |
attempt to read beyond end of climate file |
|
ERROR 341: |
cannot open scratch RDII interface file. |
|
ERROR 343: |
cannot open RDII interface file |
|
ERROR 345: |
invalid format for RDII interface file. |
|
ERROR 351: |
cannot open routing interface file |
|
ERROR 353: |
invalid format for routing interface file |
|
ERROR 355: |
mis-matched names in routing interface file |
|
ERROR 357: |
inflows and outflows interface files have same name. |
|
ERROR 361: |
could not open external file used for Time Series |
|
ERROR 363: |
invalid data in external file used for Time Series |
|
ERROR 401: |
general system error. |
|
ERROR 402: |
cannot open new project while current project still open. |
|
ERROR 403: |
project not open or last run not ended. |
|
ERROR 405: |
amount of output produced will exceed maximum file size; either reduce Ending Date or increase Reporting Time Step. |
|
Pennsylvania’s Lehigh County Authority Adopts InfoWorks CS to Manage its Wastewater Infrastructure Smart Water Modeling Network Modeling Solution To Support Authority in Optimizing Business Performance |
|||||
|
Broomfield, Colorado USA, December 6, 2011 — Innovyze, a leading global innovator of wet infrastructure modeling and simulation software and technologies, today announced that the Lehigh County Authority (LCA), Pennsylvania, has selected InfoWorks CS for managing its wastewater facilities. Located in southeastern Pennsylvania with the city of Allentown as its county seat, Lehigh County is positioned in the corridor between Philadelphia and New York City, with quick and easy access to both major metropolitan areas. LCA provides wastewater collection service for ten municipalities through a regional system of interceptors, as well as sewage collection and treatment services for individual communities where public wastewater systems are needed. “InfoWorks CS is a very powerful and comprehensive network modeling and simulation tool that will greatly assist us in planning level capacity analyses and in optimizing capital improvements for our sewer system,” said Michael Barron, P.E., Senior Project Engineer for LCA. “The software provides the flexibility, features, and computational speed to meet our dynamic sewer modeling challenges, and do so more quickly, without sacrificing the accuracy demanded by such complex projects.” InfoWorks CS allows engineers and planners to produce fast, accurate and robust fully dynamic hydraulic modeling of any complex urban collection system network. Its capabilities encompass full modeling of backwater effects and reverse flow, open channels, trunk sewers, complex pipe connections and ancillary structures. Offering exceptionally fast and stable simulations, InfoWorks CS facilitates the swift modeling of total networks or any sub-network. Users may simulate models of up to 100,000 nodes with confidence that the results will be as accurate as those for far smaller models—making it a clear choice for the world’s leading wastewater utilities. An essential tool for identifying and justifying cost effective infrastructure improvements, InfoWorks CS also provides a practical method for operational — including real time — control of the wastewater network. Other applications include urban flooding and pollution prediction and the modeling of water quality and sediment transport throughout the network. |