All Posts (522)

Sort by

Water Resources Played Important Role in Patterns of Human Settlement

ScienceDaily (Dec. 2, 2010) — Once lost in the mists of time, the colonial hydrology of the northeastern United States has been reconstructed by a team of geoscientists, biological scientists and social scientists, including University of New Hampshire Ph.D. candidate Christopher Pastore.


The results, which extend as far back as the year 1600, appear in the current issue of the journalEnvironmental Science & Technology. The findings provide a new way of uncovering the hydrology of the past and will lead to a better understanding of hydrologic systems now and in the future, the scientists say.

"We outline a methodology for synthesizing modern scientific data with historical records, including anecdotal sources," Pastore says, the paper's lead author. "It underscores the role of humans in an assessment of hydrologic change."

Throughout American history, water resources have played an integral role in shaping patterns of human settlement and networks of biological and economic exchange.

"The research emphasizes the effect of human activities on the evolution of watersheds and on the dynamics of ecosystems, important to water sustainability," says Thomas Torgersen, program director in National Science Foundation's Division of Earth Sciences, which funded the research.

The scientists divided their study area into three geographic and socio-political subregions: New England; the Middle Colonies; and the Chesapeake. They then looked at the ways in which physical variables--such as soil, vegetation, and climate--combined with socio-political factors to influence each subregion's hydrologic environment.

In New England, for example, close-knit religious communities with strong central governments concentrated their economic efforts on fur-trading and timber extraction, according to the paper's co-authors, which include Charles Vörösmarty of the City University of New York, principal investigator on the NSF grant. Vörösmarty is formerly the director of the Water Systems Analysis Group at the UNH Institute for the Study of Earth, Oceans, and Space.

The Chesapeake region, on the other hand, was settled largely by young, unskilled men who cleared trees and planted tobacco fencerow to fencerow. "This caused extensive erosion, which dramatically altered rivers," Pastore says.

The Middle Colonies were characterized by diverse social, cultural, and religious traditions and feudal-style estate agriculture.

Integration of human decision-making into analyses of land-cover change, engineering and climate change is fundamental to understanding subregional hydrologic patterns and how they interact, the scientists say.

They recommend two metrics for quantifying hydrologic change.

The first, which they call a simple water balance, takes into account precipitation, evapotranspiration, and water storage, which can be used to track changes in annual river discharge. The second, termed mean water residence time, or the average time a water molecule spends in one place, can also be used to calculate the amount of water moving through a system.

The resulting information helps determine past water residence times, which in turn allow scientists to infer changes in the biogeochemistry of rivers and streams.

Many pathogens, or disease-causing organisms, are linked to water flows. An understanding of historical water residence times, says Pastore, may lead to new insights into how diseases are transmitted today.

Our colonial past may be hydrologic prologue.

Other co-authors of the paper are: Mark Green of Plymouth State University; Daniel Bain of the University of Pittsburgh; Andrea Munoz-Hernandez of the City University of New York; Jennifer Arrigo of East Carolina University; Sara Brandt of the U.S. Geological Survey in Northborough, Mass.; Jonathan Duncan of the University of North Carolina at Chapel Hill; Francesca Greco of King's College, London; Hyojin Kim of the University of California at Berkeley; Sanjiv Kumar of Purdue University; Michael Lally of the University of Massachusetts at Amherst; Anthony Parolari of MIT; Brian Pellerin of the U.S. Geological Survey in Sacramento, Calif.; Nira Salant of Utah State University; Adam Schlosser of MIT; and Kate Zalzal of the University of Colorado at Boulder.

Disclaimer: Views expressed in this article do not necessarily reflect those of ScienceDaily or its staff.

Email or share this story:

Story Source:

The above story is reprinted (with editorial adaptations by ScienceDaily staff) from materials provided by University of New Hampshire.

Journal Reference:

  1. Christopher L. Pastore, Mark B. Green, Daniel J. Bain, Andrea Muñoz-Hernandez, Charles J. VÖrÖsmarty, Jennifer Arrigo, Sara Brandt, Jonathan M. Duncan, Francesca Greco, Hyojin Kim, Sanjiv Kumar, Michael Lally, Anthony J. Parolari, Brian Pellerin, Nira Salant, Adam Schlosser, Kate Zalzal. Tapping Environmental History to Recreate America’s Colonial Hydrology. Environmental Science & Technology, 2010; 44 (23): 8798 DOI: 10.1021/es102672c

Note: If no author is given, the source is cited instead.

Read more…

Evolution, creationism, and intelligent design are words that many people have extremely strong opinions about. Regardless of how you feel about why the laws of nature are what they are, which have evidently allowed us to exist, the evidence for the validity of the theory of evolution with one major mechanism being natural selection is absolutely overwhelming. That said, this is often very hard to communicate to people, especially those with strong biases against what they perceive as the implications of evolution, how evolution works, and why the case for it is so compelling.

Thankfully, there is a person calling him/herself cdk007 making youtube videos like this one to explain how evolution works, and why arguments against it are invalid, with dauntingly demonstrative examples:

The explanation basically boils down to, regardless of how life started, once you have even the simplest life in place that reproduces, mutates, and is subject to natural selection, you will get evolution. While reproduction and mutation are random (with far more variation occurring in sexual reproduction over asexual reproduction), natural selection is notrandom. The fact that certain traits are selected causes events that would be exceedingly improbable at random to occur all the time.

This video is excellent, and there are many others (the Bad Astronomer likes this one); I recommend them to anyone who is looking for simple, compelling examples of how this complicated biological process works. In fact, the only explanations that I've ever found easier to understand were watching Episode II of Carl Sagan's Cosmos series and watching the off-Broadway play Trumpery, a fascinating play about the scientific and personal struggles of Charles Darwin (and I think Michael Cristofer


Read more…

Subject: The relationship between the rainfall, total losses from the previous area, evaporation and infiltration only rate.


The total loss from a subcatchment pervious area is the sum of the evaporation + infiltration loss. Typically the evaporation rate is much less than the infiltration rate. SWMM 5 now has two options – evaporation during only dry periods or evaporation during both wet and dry periods.

Figure 1: An example network that shows the relationship between the rainfall, total losses from the previous area, evaporation and infiltration only rate.

Figure 2: The same model with the Evaporation during only Dry Periods turned on

Read more…

Subject: How to Determine if your model is Unstable in SWMM 5 or InfoSWMM


SWMM 5 and InfoSWMM has a good output feature in the RPT file that tells you the list of links with the highest flow instability during the simulation. If you look at the link flow with the highest instability value and it looks okay to you then it usually means the rest of your model output is stable. The index is the number of flow turns for the link during the simulation. A flow turn occurs when


  1. We call DQ the difference between the New and Old flow,
  2. The value of DQ is greater than 0.001 cfs (we do not want to count small perturbations),
  3. The sign difference between the new DQ and the Old DQ is negative. In other words we want to count those oscillations in which the DQ value was negative and is now positive or was positive and is now negative. We don’t count then when the flow is monotonically increasing or decreasing in the link.


For example, the Link U-104 below has a large number of Flow Turns but a plot of the link flow shows the Flow Turns to mainly unimportant.

Read more…

Subject: Wikipedia Traffic for the SWMM versus EPANET Articles


Wikipedia has one article for EPANET and three articles for SWMM 5 (two are redirected to the Stormwater Management Model Main Article). The statistics for the last three years (data before 2007 is unavailable) show an average of 28 visitors per day to SWMM and 16 per day to EPANET). The most common search name has switched from the word SWMM to Stormwater Management Model starting in 2009.


Read more…

InfoSWMM and H2oMAP SWMM Map Display of d/D

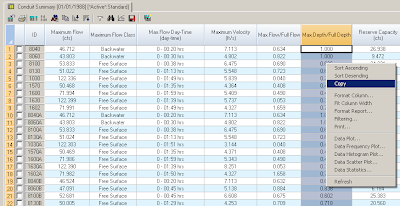
Note: You can use the Output Manager in InfoSWMM and H2OMAP SWMM to compute the peak d/D for ALL of the links in your network. Once you have the peak d/D using the tool you can copy them using the command Ctrl-C and paste them to a new field in the Conduit Information DB Table. The pasted mean flow from the Conduit Information table then can be mapped using the Map Display command


Step 1: Use Run Manager and Run the Simulation

Step 2: Use the Output Report Manager and view the Conduit Summary Table

Step 3: Select the links you want to analyze using the pick tool.

Step 4: Copy the Peak d/D values using the command Copy after a Right Mouse Click.


Step 5: Paste the Peak d/D values using the command Paste after a Right Mouse Click in the created DOVERD Field in the Conduit Information DB Table.

Step 6: Map the Conduit.DOVERD variable from the Conduit Information DB Table.

Step 7: Now Display the Peak d/D for each link.

Read more…

Note: How to change the Maximum Infiltration in a DB Table of InfoSWMM and H2OMAP SWMM


There are a lot of methods in InfoSWMM and H20MAP SWMM to change the infiltration data. You have the ability to change it for

1. an individual subcatchment using the Attribute Browser

2. by soil type and

3. the coverage of the soil over all of the subcatchments – this will alter the areal weighted average of the infiltration data


You have layers of infiltration data in the interface to your model data. The infiltration parameters are defined per soil as in a real watershed and the subcatchments will use the areal weighted infiltration values of all of the soils on the subcatchment. You get more flexibility and closer to the physical reality of the subcatchment by having layers of soil on the subcatchment rather than one set of infiltration per subcatchment. Of course if you set up one soil type per subcatchment then you will have 100 percent coverage of the same infiltration set of parameters per subcatchment.


Method 1: An Individual Subcatchment by using the Attribute Browser


Method 2: All of the Infiltration Data in the Soil Tables using the DB Editor and the Block Edit command.


Method 3: You can also change the overall Infiltration by changing the soil coverage of the Subcatchment using the Subcatchment Infiltration table.


Read more…

Manhole Elevations in InfoSWMM and SWMM 5

Subject: Manhole Elevations in InfoSWMM and SWMM 5


Starting from the bottom of the manhole you have these regions of computational interest:


1.Manhole Invert to the lowest link invert – the node continuity equation is used with the area of the manhole being the default surface area of a manhole,


2.Lowest Link Invert to the Highest Link Crown Elevation – the node continuity equation is used with surface of the node being normally half of the surface area of the incoming and outgoing links,


3.Highest Manhole Pipe Crown Elevation to Manhole Rim Elevation – the node surcharge algorithm in which the surface area of the manhole is not used and the surcharge depth is iterated until the inflow and the outflows of the node are in balance,


4.The region above the Manhole Rim Elevation which can use one of four options to calculate the depth and/or flow out of or into the manhole:


1.No Surcharge Depth is entered and No Ponding area is used – the excess water into the manhole is lost to the network and shows up as internal outflow in the continuity tables,

2.A Ponding Area is used and the excess flow will pond on the surface of the manhole and later go back down into the conveyance pipes.

3.A Surcharge Depth is used and the depth will continue to be calculated using the node surcharge algorithm in which the surface area of the manhole is not used and the surcharge depth is iterated until the inflow and the outflows of the node are in balance,

4.A Dual Drainage system is simulated and the excess flow of the manhole is simulated in the street gutters or the actual street,

5.You use a 1D/2D linkage between the 1D manhole and 1D links to a 2D Mesh and simulate the flow out and the flow into the manhole using a bottom outlet orifice that switches automatically between weir and orifice flow based on the depth on top of the manhole.

Read more…

Subject: Pump / Force Main System in InfoSWMM and SWMM 5


The basic system consists of:

· Wet Well and its associated physical parameters,

· Pump Type

· Defined Pump Curve,

· Downstream Pressure Node and

· Downstream Force Main

Figure 1: The Basic System

Step 1: Wet Well Data

Enter the invert elevation, maximum depth of the Wet Well, the physical shape as either a function or shape table and any evaporation or infiltration.

Step 2: Define the Pump Type

The pump type is defined by a Pump Curve and the On and Off elevations:

The four types of pumps are:

· Volume - Flow

· Depth – Flow

· Head – Flow

· Depth - Flow

Step 3: Define the Pump Curve in the Operation Tab

Step 4: Set a Surcharge or Pressure Depth at the Downstream end of the Pump

Any positive Surcharge Depth in the Node will allow the program during the simulation to keep the node under pressure forcing flow through the Force Main.

Step 5: Force Main Data

Define the downstream pipe(s) from the pump as Force Main conduits with either a Hazen Williams or Darcy-Weisbach coefficient (defined in the SWMM 5 options or the Run Manager of InfoSWMM)

Step 6: HGL Plot of the Force Main System

Step 7: Pump Summary in the RPT File

Read more…

Buildup/Washoff from a Subcatchment in SWMM 5

Subject: Buildup/Washoff from a Subcatchment in SWMM 5


A pollutant concentration from a subcatchment in SWMM 5 can come from the precipitation, event mean concentration (EMC) in the washoff, rating curve washoff as a function of the surface runoff or power/exponential washoff from pollutants built up on the land surface. The pollutant washoff is mixed in the node and links for the network and can undergo first order decay, BMP or LID removal and CSTR mixing.


Figure 1: The COD buildup in pounds or kilograms from the initial loading, dry day loading and interevent loading.

Figure 2: The COD Washoff based on the amount built up and the amount of runoff.

Figure 3: The COD concentrations washing off the watershed based on the washoff equation, the runoff and the amount of buildup.

Figure 4. COD Exponential Washoff and the Runoff from one Subcatchment.

Read more…

Subject: Drainage Wells or a Vertical Exfiltration Trench in InfoSWMM

Note, this is just one way to model an Exfiltration Trench. The source for the image below is Rice Creek Watershed.

You can make a storage node to simulate the trench with the following characteristics:

· Functional or Shape Curve to describe the shape of the trench,

· Infiltration parameters to simulate the infiltration flow out of the bottom or sides of the trench,

Step 1: Define the shape and geometrical characteristics of the Infiltration Trench

Step 2: Define the soil infiltration characteristics of the trench


Step 3: Run the simulation. The Storage Volume Summary tells you the volume infiltrated and the average outflow.

Step 4: Output Manager will also show the infiltration outflow, the depth and the volume of the infiltration/storage node.

Step 5: Infiltration losses out the side and bottom of the orifice.


Read more…

Weirs in InfoSWMM and SWMM 5

Subject: Weirs in InfoSWMM and SWMM 5


Figure 1 shows the relationship between the weir input data and the upstream and downstream nodes.

· Height,

· Crest and

· Node Invert Elevation


There are four types of weirs and if the weir becomes submerged downstream the Villemonte weir submergence correction is applied (Figure 2). You can have flow reversal across the weir unless you use a Flap Gate for the weir (Figure 3).


Figure 1: Definition of Weir Terms

Figure 2: Villemonte Weir Submergence Correction

Figure 3: Flow Reversal in a Weir

Read more…

Subject:  How to make Multiple Storm Events in InfoSWMM and How to Use them in the Scenario Manager

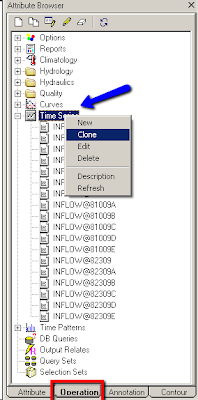
Step 1.  Make a new Time Series to hold the data points for your new Rainfall Time Series in the Operation Tab of the Attribute Browser.


Step 2.  Populate the Rainfall Distribution with a SCS Type II Hyetograph with a 1 inch rainfall total


Step 3.  Now Clone the created Rainfall Distribution and make 10, 25, 50 and 100 year storm events each with 1 inches of rainfall in a cumulative distribution.


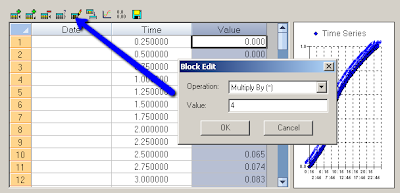
Step 4.  Now use the Block Edit command and convert each of the newly created hyetographs to 4, 7, 10, 15 and 20 inch cumulative rainfall totals from the original 1 inch rainfall total (for example).


Step 5.  Now create a Raingage for each of the newly created hyetograph time series using the DB Editor under the Raingage Table in Hydrologic Data


Step 6.  Link the Time Series to the new Raingages and define the type (cumulative), units (inches) and hyetograph interval (15 minutes)


Step 7. Make 4 New Scenarios for the different return period hyetographs,  the Base Scenario will use the 5 year or 4 inch SCS II rainfall.


Step 8Use the DataSet Manager and make 4 new Subcatchment DB Tables in which each Subcatchment Set uses a different return period hyetograph.


Step 9. Run the Batch Simulator for all 5 scenarios including the Base Scenario.


Step 10.  You can  use the Output Report Manager to see the Rainfall for all of the Batch Runs to check if the proper rainfall was used for each Scenario Simulation.

Read more…

Note: What Node and Link Invert Elevations Does SWMM 5 Use?

SWMM 5 uses the following Node information from the user:

· Node Invert Elevation,

· The Node Rim Elevation which is the Node Invert Elevation + the Maximum node depth

· The Ponded Area when the Ponded Area option is used

· The Surcharge Depth above the Node Rim Elevation

SWMM 5 uses the following link information from the user:

· The Link Upstream Offset Depth or Offset Elevation and

· The Link Downstream Offset Depth or Offset Elevation

· The Link Maximum Depth or Diameter

SWMM 5 calculates the following information internally:

· The Pipe Crown Elevation at the upstream and downstream link nodes. The Pipe Crown is the Pipe Diameter + Link Offsets

· The Node Highest Pipe Crown Elevation,

· The Surcharge Depth above the Rim Elevation if the Node has a Surcharge Pressure Depth at the Node during the simulation,

o If the Surcharge Depth is 0 then the program will either lose the flooded water or store the flooded water during the simulation

· The Flooded Depth above the Rim Elevation if the Node uses the Ponded Area Option

o You have to enter a Ponded Area for the node AND use the Global Allow Ponding Option

SWMM 5 Rules for Pipes

· The Pipe Invert Cannot be below either upstream or downstream node invert – the program will print a warning in the rpt file and set the offset to 0 internally,

· The Pipe Crown Cannot be above the Rim Elevation of the Node – the program will raise the Rim Elevation when this happens and print a warning in the rpt file.

The use of Offset Depth or Offset Elevation for the Link Offsets is based on the user choice at the bottom of the SWMM 5 GUI Map.

Or in the Tools/Preference/Operation dialog of InfoSWMM/H20MAP SWMM

Read more…

In Haiti, fighting cholera with a water machine


It was everyone’s worst nightmare:cholera has reportedly moved from the rural areas of Haiti to the island nation’s capital city, Port-au-Prince.

Now, the main water source to the city is contaminated with a bacteria, and crowded city dwellers are at risk of contracting an infection.

Cholera is hard to control once it makes its way into the water supply. The moment a person drinks the bacterium Vibrio cholerae, it settles into the small intestine. It can take anywhere from several hours to five days before the victim experiences watery diarrhea and vomiting.

If the person doesn’t quickly re-hydrate with clean water — and take a dose of antibiotics — it can be fatal.

More

Read more…

MWH Soft Announces Second Quarter 2011 Release of IWLive: Real Time Forecasting and Operation of Water Distribution Systems

Revolutionary New Product to Equip Water System Control Rooms with Unprecedented Decision-Making Capability


Broomfield, Colorado USA, November 9, 2010 — MWH Soft, a leading global innovator of wet infrastructure modeling and simulation software and technologies, today announced the second quarter 2011 release of IWLivefor real time water distribution hydraulic modeling, forecasting and SCADA integration. The groundbreaking release will give InfoWorks WS and InfoWater users worldwide the ability to move their hydraulic modeling and simulation applications from planning and design to operation and control. The product builds on the success of MWH Soft’s Floodworks product line for real-time flood and collection system forecasting. This latest debut reflects MWH Soft’s vanguard position in the water industry and its continuing commitment to delivering pioneering technology for enhancing the safety and reliability of the world’s water supply.

Intended for use in the water distribution control room, IWLive will give operators unprecedented decision making ability. They will be able to run accurate hydraulic simulations that factor in energy costs, weather, real time (or delayed) SCADA telemetry, demand history, valve and pumping control scenarios. Beyond increasing efficiency and reducing energy consumption, IWLive can help control room operators understand the effects of main breaks, pump shutdowns, or other scheduled maintenance.

IWLive equips the control room with tools that are both more predictive and more reactive. It issues regularly updated warnings to draw the operator’s attention to problems that may occur in the coming minutes, hours, or days. The control room operator can see the predicted severity of problems and the time of onset in one easy to use interface. Beyond automatic prediction, it can also enable the control room operator to evaluate problem-solving approaches by simulating the closure of valves or a change in a pump’s operating schedule. IWLivequickly produces a second simulation that can be compared with the first to determine the level of improvement, the problems that remain, and the costs of the change.

The IWLive interface is fully optimized for operator use. It allows operators to see a map of all water infrastructures for which they are responsible, including appropriate background maps. Highlighted color coding shows predicted problem areas; a single click produces a detailed map showing pipes, valves, pumps, reservoirs and other water assets. Animation of the map shows the development of the problem; graphs show simulated pressures and reservoir levels. IWLive can be accessed remotely over a VPN. It can also be configured to send critical warning messages via SMS or email.

“Hydraulic modeling is an invaluable tool for water utility planning and engineering departments,” said Paul F. Boulos, Ph.D, Hon.D.WRE, F.ASCE, President and Chief Operating Officer of MWH Soft. “However, translating these benefits to real time utility operations has proven difficult. With IWLive, MWH Soft has changed the paradigm for how and where hydraulic models can be applied. This innovative milestone solution will allow the entire organization to improve system performance and reliability, enhance customer service, save money, safeguard critical infrastructures and maximize their ability to protect public health.”

Read more…
Registration and Call for Papers Announced for 2011 Asia Pacific Water and Sewer Systems Modeling Conference
Major Industry Event to Unite Global Modeling Experts March 30-31, 2011, at Gold Coast, Australia Register at www.asiapacificwater.com
Broomfield, Colorado USA, November 2, 2010
MWH Soft, a leading global innovator of wet infrastructure modeling and simulation software and technologies, today announced the opening of registration and a call for papers for the fourth annual Asia Pacific Water and Sewer Systems Modeling Conference. The event, widely considered to be the most comprehensive and significant wet infrastructure modeling, design and management technology conference of its kind, will be held from March 30-31, 2011, at the Hotel Grand Chancellor Surfers Paradise on Australia’s Gold Coast.

This once-a-year learning opportunity is sponsored by major water utilities and associations in the region. It will feature keynote presentations from leaders in hydraulic and water quality modeling throughout Asia, Europe, North America, Australia and New Zealand. The conference also incorporates an annual gathering of MWH Soft software users and their managers who want to sharpen their skills, expand their knowledge, and share best practices with their peers. The ultimate goals are to design, operate and manage better systems; protect the environment; and safeguard public health.

The forum will allow water, wastewater and stormwater professionals to explore new ways of using engineering GIS technology, advanced network modeling and simulation, and asset management applications. Participants will learn how they can leverage these tools to do their jobs better, easier, faster and more efficiently; maximize their return on software investments; and make their organizations more globally competitive. They will also earn valuable Chartered Professionals Continued Professional Development (CPD) hours.

“Potable water and sanitary sewer systems are essential for a healthy and vibrant community,” notes Justin Hanson, Asia-Pacific Business Development Manager for MWH Soft and co-chair of the conference organizing committee. “Proper management of water and wastewater assets plays a critical role in the provision of these vital services. This leading wet infrastructure focused conference is both fun and educational. I am confident that attendees will come away better positioned to provide their communities with reliable and cost-effective safe drinking water and sanitary sewer systems.”

To supplement the keynote presenters and speakers already confirmed, the organizing committee is seeking relevant and unique presentations. Key topics include:

•Reducing network carbon footprint
•Maximizing energy cost savings
•Real-time operation and management of water distribution systems
•Analyzing sewer collection and river systems
•Optimizing capital improvement programs
•Using surge/transient analysis for optimum system design and protection
•Improving overflow management
•Conducting vulnerability assessment and consequence management
•Developing, calibrating and validating rigorous water quality models
•Water temperature, variable speed pump and multi-species modeling
•Designing, operating and retrofitting storage facilities to maintain water quality
•Developing effective unidirectional flushing programs
•Using network modeling for regulatory compliance
•Protecting and securing infrastructure systems
•Reducing inflow/infiltration
•Integrated approaches to drainage modeling in urban areas
•Improved business performance with GIS and asset management
•Fire fighting and fire flow analysis
•Priority Infrastructure Planning (PIP)
•Pressure and leakage management
•Hydrogen sulfide modeling and reduction
The agenda will also feature hands-on software demonstrations, discussions of business implementation and management issues, industry solutions presentations, key technology updates, and social and networking events.

Keynote speaker Paul F. Boulos, Ph.D., Hon.D.WRE, F.ASCE, President and Chief Operating Officer of MWH Soft, will address the conference on the latest technologies in water, stormwater, and wastewater network modeling, capital planning and asset management. “This exceptionally fun and educational event is always guaranteed to energize and inspire,” said Boulos. “It provides a wonderful forum for sharing best practices and exploring the state of the art in water/wastewater infrastructure engineering, design and management solutions designed to help solve everyday challenges and problems. Attendees can carry this valuable knowledge back to their organizations, opening new avenues for increasing productivity and performance, enhancing project quality, maximizing return on their software investments, gaining a competitive edge on the future, advancing their careers, and improving the quality of life in their communities. They’ll leave restored, energized, and better prepared to accomplish great things. They’ll also play a significant a role in the future of MWH Soft and our products, inspiring us and pushing us to build great products, a great company, and a great community.”

Abstract Submission
To have your abstract considered for oral presentation, please submit a not-to-exceed 250-word abstract with title and author information on any of the above topics. Abstracts should be submitted via the following form as soon as possible and no later than 10 December 2010.

Conference Registration
For more information or to register for the conference, visit http://www.asiapacificwater.com, contact the conference information office at +61 7 5506 5703, fax +61 7 5506 5799, or e-mail asiapacific@mwhsoft.com. Because space is limited, early registration is encouraged.
Read more…