All Posts (522)

Sort by

Subject:  The number of Hydraulic Iterations in Various Versions of SWMM 5.

The maximum number of iterations was 4 before SWMM 5.0.021 and 8 iterations after SWMM 5.0.021.  In InfoSWMM and H2OMAP SWMM  you can have a a minimum of 2 iterations or a maximum of 8 iterations for compatibility to SWMM 5 and backwards compatibility with your earlier InfoSWMM models.

.  


Read more…

Time Step Selection in SWMM 5


1st The time step you use in SWMM 5 is controlled from the top by the rainfall interval (Figure 1):

1.   All of your time steps should be less than the rainfall interval,

2.   The hydrology time step should be less than or equal to the smallest raingage rainfall interval in your network,

3.   The hydraulic time step should be less than or equal to the hydrology time step and should be based on the hydraulic needs of the your network.  Short length links, pump and weirs may require a smaller maximum hydraulic time step.

2nd The report time step controls what you see in the graphics output of SWMM 5. If you see a large difference between that you see in the graphics output and the report text file it is because you have a large difference between the report time step and the average time step used during the simulation.

Solution: If there is a large discrepancy in the graphics and report text file then the best solution is to reduce the maximum time hydraulic time step so it is closer to the average time step and also to make the report time step closer to the Maximum time step (Figure 2).
Figure 1:  Relationship between the rainfall, hydrology and hydraulic time steps.


Figure 2:  Relationship between the minimum, average and maximum simulation time steps and the report time step.

Read more…

Pump Priorities in SWMM 5

Subject: Pump Priorities in SWMM 5

The Startup and Shutoff depths are evaluated 1st followed by any Control Rules. The priority value is just to decide between two or more control rules that are both active at the current time step. The rule with the highest priority will be used or in the case of two rules with the same priority the last control rule evaluated will be used during the current time step.

Read more…

UK Water Industry Rapidly Adopts InfoWorks ICM for Integrated All-Source Flood Modeling

Built for Reliability, Speed and Power, MWH Soft’s Leading-Edge Technology Enables Water Utilities Worldwide to Achieve Engineering Excellence in Integrated Catchment Modeling

Broomfield, Colorado USA, December 21, 2010

MWH Soft, a leading global innovator of wet infrastructure modeling and simulation software and technologies, today announced that its recently released InfoWorks ICM for integrated river, sewer and overland flow modeling is being quickly adopted across the United Kingdom. Water utilities, local authorities and engineering firms are proving eager to harness the advanced solution’s industry-leading capabilities on a range of new and existing projects.

Following a number of serious floods in the UK such as the one in the Cornish town of Boscastle in 2004, the UK government announced a mandate to “set out a portfolio of approaches to ensure that flood risks would be managed more effectively in the future by adopting a holistic, joined-up, and integrated approach.” The UK Flood Risk Regulations of 2009 and the Floods and Water Management Act of 2010 require each local authority to “develop, maintain, apply and monitor a strategy for local flood risk management in its area,” and stipulate that where flooding occurs, they must investigate what should be done and by whom. Within this new, more stringent context, InfoWorks ICM has been a clear choice for developers of the required Surface Water Management Plans and Flood Risk Assessment Reports.

A hallmark of InfoWorks ICM is the integration of hydrodynamic and hydrological models within the powerful workgroup management platform to enable comprehensive assessment of the environmental impact from urban catchments on the receiving waters and sound planning of wet weather discharges in urban drainage systems. InfoWorks ICM provides a single simulation engine that fully integrates one-dimensional (1-D) hydrodynamic simulation of flows in rivers, open channels and pipe networks with two-dimensional (2-D) hydrodynamic simulation of surface flooding in the urban environment and river floodplain. This industry-leading development provides a powerful solution for simultaneously modeling below-ground and above-ground elements of catchments to accurately represent all flow paths and improve understanding of the processes occurring in the holistic environment. The software also takes into account interactions of natural and man-made environments and effectively simulates the water quality impact of polluting runoff and effluent from urban areas. Such advanced capabilities greatly enhance the ability of water utilities to conceive and evaluate sound and reliable urban catchment strategies such as storm sewer separation, active real-time control and provision of adequate additional storage.

“What attracted us to Infoworks ICM was the ability to model interlinked above- and below-ground systems that include infiltration type Sustainable Urban Drainage Systems (SUDS), watercourses and tidal outfalls,” commented Jason Wakefield, Drainage Engineer for Ipswich Borough Council, UK. “The ability to output flood maps, including Hazard Ratings, and the flexible pricing structure were also key factors in our purchase. We believe InfoWorks ICM will be very useful for developing and managing long-term Surface Water Management Plans, especially where SUDS are a component.”

InfoWorks ICM builds on MWH Soft’s powerful workgroup management modeling platform and complements it with a host of new technological enhancements. While it supports the running of model simulations on stand-alone workstations, simulation can be distributed to take maximum advantage of settings where more computing resources are available, either within a small workgroup or within an enterprise system with dedicated servers and central storage. Advanced database and processing technologies allow InfoWorks ICM to deliver real power to end users when modeling large networks under a wide range of scenarios, producing a higher level of detail than ever before and a high degree of confidence in the ultimate results. Support for the latest 64-bit Windows operating systems and multiprocessor workstations allow complex simulations to be accomplished more quickly and efficiently. The option to employ increasingly affordable specialized graphics cards offers the potential for significant improvement in the speed of 2D simulations. An easy-to-use scenario manager allows the user to quickly apply different “what if” scenarios to the base network model.

InfoWorks ICM gives us the cutting-edge technology we need to provide the finest engineering solutions to our customers,” said Richard Allitt, Director of Richard Allitt Associates. “By allowing us to model all sources of flooding in a single software package, these advances set the product apart from those offered by other vendors.”

“We are delighted that InfoWorks ICM has quickly been adopted as the software of choice for integrated flood modeling by leading UK utilities, local authorities and engineering consultancies,” said Andrew Brown, EMEA Regional Manager for MWH Soft. “We are committed to continually delivering leading-edge solutions to water industry professionals, enabling them to meet the challenges they face in the most reliable, efficient and cost effective manner.”


Read more…

Node Surcharge Summary in SWMM 5

Subject: Node Surcharge Summary in SWMM 5


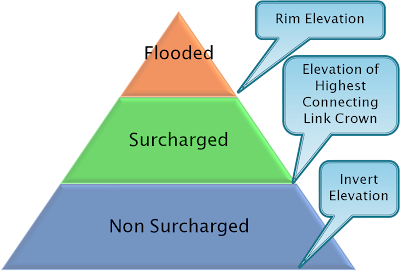
Surcharging occurs in SWMM 5 when water rises above the crown of the highest conduit. The RPT file of SWMM 5 lists the surcharging in hours in the Node Surcharge Summary Table (Figure 1) using the definitions for surcharging shown in Figure 2. Figure 3 shows the relationship between the output columns of the table.


Node surcharging occurs at a node if:

1. The node cannot pond and the node depth is above the highest pipe crown elevation connected to the node, or

2. The node can pond and the node depth is above the highest pipe crown elevation connected to the node and

3. The node depth is below the full depth of the node.


Node Flooding occurs if the water surface elevation is at the rim or above the rim elevation of the node.


Figure 1: Node Surcharge Summary Table

Figure 2: Definition of Surcharging at a Node in SWMM 5.

Figure 3: The definition of the Height above Crown and Depth below Rim columns in the Node Surcharge Table.


Read more…

Note: There is a function called ForceMain in SWMM5/InfoSWMM whose purpose is to compute the Darcy-Weisbach friction factor for a force main using the Swamee and Jain approximation to the Colebrook-White equation.


f = forcemain_getFricFactor(xsect.rBot, d/4.0, 1.0e12);

return sqrt(f/185.0) * pow(d, (1./6.));


double forcemain_getFricFactor(double e, double hrad, double re)

////  Input:   e = roughness height (ft)

//           hrad = hydraulic radius (ft)

//           re = Reynolds number

//  Output:  returns a Darcy-Weisbach friction factor

//  Purpose: computes the Darcy-Weisbach friction factor for a force main

//           using the Swamee and Jain approximation to the Colebrook-White  equation.

{    double f;

if ( re < 10.0 ) re = 10.0;

if ( re <= 2000.0 ) f = 64.0 / re;

else if ( re < 4000.0 )

{        f = forcemain_getFricFactor(e, hrad, 4000.0);

f = 0.032 + (f - 0.032) * ( re - 2000.0) / 2000.0;    }

else    {        f = e/3.7/(4.0*hrad);

if ( re < 1.0e10 ) f += 5.74/pow(re, 0.9);

f = log10(f);

f = 0.25 / f / f;    }

return f;}


From http://en.wikipedia.org/wiki/Darcy_friction_factor_formulae

Read more…

Link Surcharging Definitions in SWMM 5

Subject: Link Surcharging Definitions in SWMM 5


The report or RPT text output file of SWMM 5 contains a table that lists the Surcharged Conduits during the simulation (Figure 1).


The  5 columns in  the table are:

  1. Hours Both Ends Surcharged
  2. Hours Upstream End Surcharged
  3. Hours Downstream End Surcharged
  4. Hours Above Full Normal Flow
  5. Hours Capacity Limited

.the five columns are defined in Figure 2.  Notice that if the midpoint of the link is full then the link and both end of the link are considered to be surcharged.  If the midpoint is NOT full then the cross sectional area of the ends of the link determine wheter the ends of the link are considered surcharged.  The end of a link can be considered surcharged based on either the depth at the midpoint or the cross sectional area at the end of the link.


Figure 1: The SWMM 5 Conduit Surcharge Table


Figure 2: The SWMM 5 Conduit Surcharge Table Definitions, the numbers in the 3rd column correspond to the columns in the Conduit Surcharge Table.

Read more…

PID Control in SWMM 5 for an Orifice

Click here to download:
extran_pid_3_master.inp (47 KB)


Subject: PID Control in SWMM 5 for an Orifice


The blog http://swmm5.blogspot.com/2010/12/pid-control-in-swmm-5-for-type-3-pump.html describes the Function getPIDSetting which returns the PID setting at each time step. The PID parameter set contains three values -- a proportional gain coefficient, an integral time (in minutes), and a derivative time (in minutes) which are kp, ki and kd, respectively. More about the theory of PID controllers can be found at http://en.wikipedia.org/wiki/PID_controller.


Here is an example PID Rule that will keep the node depth at 5 feet in a SWMM 5 model by changing the Orifice Setting. The Orifice setting opens and closes the orifice over time. The example file is attached in this blog. In this particular example, you can reduce the oscillations about the 5 foot rule level by lowering the integral time and derivative time coefficients in the PID control rule. An important note is that for Weirs and Orifices the setting is bounded to be between 0 and 1. If the Orifice or Weir cannot handle the upstream node inflow then the PID control will not be able to meet the depth goal in the node. For example, in the example file, an orifice depth of 2 feet is not enough to meet the upstream node depth goal of 5 feet but a 3 foot orifice is large enough for the PID control to meet its stated goal of 5 feet. The PID control will only work if the link doing the controller has enough flow and depth flexibility.


RULE PID_Orifice

; the PID controller adjusts the orifice opening to have a

; depth of 3 feet in Node 82309b

IF NODE 82309b DEPTH <> 5

THEN ORIFICE OR1@82309b-15009b SETTING = PID 10 -0.01 -0.01

; kp ki kd

PRIORITY 1


Read more…

PID Control in SWMM 5 for a Weir

Subject: PID Control in SWMM 5 for a Weir

The blog http://swmm5.blogspot.com/2010/12/pid-control-in-swmm-5-for-type-3-pump.html describes theFunction getPIDSetting which returns the PID setting at each time step.  The PID parameter set contains three values -- a proportional gain coefficient, an integral time (in minutes), and a derivative time (in minutes) which are kp, ki and kd, respectively. More about the theory of PID controllers can be found at  http://en.wikipedia.org/wiki/PID_controller.

Here is an example PID Rule that will keep the node depth at 3 feet in a SWMM 5 model by changing the Weir Setting.  The example file is attached in this blog.  In this particular example, you can reduce the oscillations about the 3 foot rule level by lowering the integral time and derivative time coefficients in the PID control rule.


RULE PID_Weir

; the PID controller adjusts the weir height to have a

;     depth of 3 feet in Node 82309e

IF NODE 82309c DEPTH <> 3

THEN WEIR WEIR1@82309c-15009c SETTING = PID 10 -.01 -.01

;                                           kp ki  kd

PRIORITY 1


Read more…

PID Control in SWMM 5 for a Type 3 Pump

Subject: PID Control in SWMM 5 for a Type 3 Pump


Figure 2 shows the code in Function getPIDSetting which returns the PID setting at each time step. The PID parameter set defines the degree of control. The PID parameter set contains three values -- a proportional gain coefficient, an integral time (in minutes), and a derivative time (in minutes) which are kp, ki and kd, respectively. More about the theory of PID controllers can be found at  http://en.wikipedia.org/wiki/PID_controllerand shown in Figure 3.


Here is an example PID Rule that will keep the node depth at 3 feet in a SWMM 5 model.


RULE PID1

; the PID controller adjusts the flow in the pump to have a

;     depth of 3 feet in Node 82309e

IF NODE 82309e DEPTH &lt;&gt; 3

THEN PUMP PUMP1@82309e-15009e SETTING = PID  10     -1  -1

;                                                                                                                kp     ki   kd

PRIORITY 1


Figure 1:  SWMM 5.0.021 Simulation Results

Figure 2:  Source code for getPIDSetting in SWMM 5.0.021

Figure 3:  Image source for the Block Diagram of a PID Controller Pid-feedback-nct-int-correct.png


Read more…

Florida shivers; Hot Arctic-Cold Continents pattern is back

http://www.wunderground.com/blog/JeffMasters/article.html


Cold air sweeping southwards behind the fierce snowstorm that roared through the Upper Midwest over the weekend is bringing record low temperatures over much of the Southeast this morning. However, preliminary indications are that Central Florida's orange groves fared better than expected, and there were no reports of widespread damage to the orange crop. Record lows this morning included 32°F at West Palm Beach, 50°F in Key West, and 20°F in Jacksonville. Cold air flowing over the relatively warm waters of Lake Erie and Lake Ontario are creating heavy lake-effect snows, with 5 – 9 inches of new snow expected near Cleveland, OH today, and 2 – 5 inches near Syracuse, NY.

Hot Arctic-Cold Continents
I'm in San Francisco this week for the world's largest gathering of Earth scientists, the annual American Geophysical Union (AGU) conference. Over 15,000 scientists have descended upon the city, and there are a ridiculous number of fascinating talks on every conceivable aspect of Earth science, including, of course, climate change. One talk I attended yesterday was called, "Hot Arctic-Cold Continents: Hemispheric Impacts of Arctic Change.” The talk was given by Dr. Jim Overland of NOAA's Pacific Marine Environmental Laboratory, one of the world's experts on Arctic weather and climate (I spent many long months flying in the Arctic with him during the three Arctic field programs I participated in during the late 1980s.) Dr. Overland discussed the remarkable winter of 2009 – 2010, which brought record snowstorms to Europe and the U.S. East Coast, along with the coldest temperatures in 25 years, but also brought the warmest winter on record to Canada and much of the Arctic. He demonstrated that the Arctic is normally dominated by low pressure in winter, and a “Polar Vortex” of counter-clockwise circulating winds develops surrounding the North Pole. However, during the winter of 2009-2010, high pressure replaced low pressure over the Arctic, and the Polar Vortex weakened and even reversed at times, with a clockwise flow of air replacing the usual counter-clockwise flow of air around the pole. This unusual flow pattern allowed cold air to spill southwards and be replaced by warm air moving poleward. This pattern is kind of like leaving the refrigerator door ajar--the refrigerator warms up, but all of the cold air spills out into the house.


Figure 1. Conceptual diagram of how Arctic sea ice loss affects winter weather, from NOAA's Future of Arctic Sea Ice and Global Impacts web page.

The North Atlantic Oscillation (NAO)
This is all part of a natural climate pattern known as the North Atlantic Oscillation (NAO), which took on its most extreme configuration in 145 years of record keeping during the winter of 2009 – 2010. The NAO is a climate pattern in the North Atlantic Ocean of fluctuations in the difference of sea-level pressure between the Icelandic Low and the Azores High. It is one of oldest known climate oscillations--seafaring Scandinavians described the pattern several centuries ago. Through east-west oscillation motions of the Icelandic Low and the Azores High, the NAO controls the strength and direction of westerly winds and storm tracks across the North Atlantic. A large difference in the pressure between Iceland and the Azores (positive NAO) leads to increased westerly winds and mild and wet winters in Europe. Positive NAO conditions also cause the Icelandic Low to draw a stronger south-westerly flow of air over eastern North America, preventing Arctic air from plunging southward. In contrast, if the difference in sea-level pressure between Iceland and the Azores is small (negative NAO), westerly winds are suppressed, allowing Arctic air to spill southwards into eastern North America more readily. Negative NAO winters tend to bring cold winters to Europe and the U.S. East Coast, but leads to very warm conditions in the Arctic, since all the cold air spilling out of the Arctic gets replaced by warm air flowing poleward.

The winter of 2009 - 2010 had the most extreme negative NAO since record keeping began in 1865. This "Hot Arctic-Cold Continents pattern", resulting in a reversal of Polar Vortex and high pressure replacing low pressure over the Arctic, had occurred previously in only four winters during the past 160 years—1969, 1963, 1936, and 1881. Dr. Overland called the winter of 2009 – 2010 at least as surprising at the record 2007 loss of Arctic sea ice. He suspected that Arctic sea ice loss was a likely culprit for the event, since Francis et al. (2009) found that during 1979 - 2006, years that had unusually low summertime Arctic sea ice had a 10 - 20% reduction in the temperature difference between the Equator and North Pole. This resulted in a weaker jet stream with slower winds that lasted a full six months, through fall and winter. The weaker jet caused a weaker Aleutian Low and Icelandic Low during the winter, resulting in a more negative North Atlantic Oscillation, allowing cold air to spill out of the Arctic and into Europe and the Eastern U.S. Dr. Overland also stressed that natural chaos in the weather/climate system also played a role, as well as the El Niño/La Niña cycle and natural oscillations in stratospheric winds. Not every year that we see extremely high levels of Arctic sea ice loss will have a strongly negative NAO winter. For example, the record Arctic sea ice loss year of 2007 saw only a modest perturbation to the Arctic Vortex and the NAO during the winter of 2007 – 2008. 

However, the strongly negative NAO is back again this winter. High pressure has replaced low pressure over the North Pole, and according to NOAA, the NAO index during November 2010 was the second lowest since 1950. This strongly negative NAO has continued into December, and we are on course to have a top-five most extreme December NAO. Cold air is once again spilling southwards into the Eastern U.S. And Europe, bringing record cold and fierce snowstorms. At the same time, warm air is flowing into the Arctic to replace the cold air spilling south--temperatures averaged more than 10°C (18°F) above average over much of Greenland so far this month. The latest 2-week forecast from the GFS model predicts that the Hot Arctic-Cold Continents pattern will continue for the next two weeks. However, the coldest air has sloshed over into Europe and Asia, and North America will see relatively seasonable temperatures the next two weeks.

For more information
The NOAA web page, Future of Arctic Sea Ice and Global Impacts has a nice summary of the “Hot Arctic-Cold Continents” winter pattern.

NOAA's Arctic Report Card is also a good source of information.

Francis, J. A., W. Chan, D. J. Leathers, J. R. Miller, and D. E. Veron, 2009: Winter northern hemisphere weather patterns remember summer Arctic sea-ice extent. Geophys. Res. Lett., 36, L07503, doi:10.1029/2009GL037274.

Honda, M., J. Inoue, and S. Yamane, 2009: Influence of low Arctic sea-ice minima on anomalously cold Eurasian winters. Geophys. Res. Lett., 36, L08707, doi:10.1029/2008GL037079.

Overland, J. E., and M. Wang, 2010: Large-scale atmospheric circulation changes associated with the recent loss of Arctic sea ice. Tellus, 62A, 1.9.

Petoukhov, V., and V. Semenov, 2010: A link between reduced Barents-Kara sea ice and cold winter extremes over northern continents. J. Geophys. Res.-Atmos., ISSN 0148-0227.

Seager, R., Y. Kushnir, J. Nakamura, M. Ting, and N. Naik (2010), Northern Hemisphere winter snow anomalies: ENSO, NAO and the winter of 2009/10, Geophys. Res. Lett., 37, L14703, doi:10.1029/2010GL043830.


Read more…

Subject: Total Time Above Rim Elevation at a Node


1. Total Surcharge Time is the total time above the crown of the highest connecting pipe to a node.

2. Total Time Above Rim Elevation – this is the flooding time of the node and it includes flood time as well as ponding time. You can find this in the Junction Summary Report of InfoSWMM under the column Total Flood Time. The Total Flood Time is less  than the Total Surcharge Time as the depth in the Node is higher.

  1. A node is flooded if the node depth equals the node rim elevation – the flooded time is the total time excess flow coming out the top of the manhole,
  2. A node is flooded if the node depth is above the rim elevation and you are using the Surface Ponding Option – the flooded time is the ponding time
  3. A node is flooded if the node depth equals the node surchage elevation – the flooded time is the total time excess flow coming out the top of the surcharged manhole.


Read more…

Niagara Falls in 1969

Niagara Falls in 1969

Well This Is Something You Don&#8217;t See Every Day of the Day: A Connecticut man accidentally stumbled onto a shoebox containing a set of never-before-seen photos snapped by his in-laws from the time the U.S. Army Corp of Engineers turned off the water on the American side of Niagara Falls. From the Daily Mail: In June 1969, U.S. engineers diverted the flow of the Niagara River away from the American side of the falls for several months. Their plan was to remove the large amount of loose rock from the base of the waterfall, an idea which they eventually abandoned due to expense in November of that year. [&#8230;] To achieve this the army had to build a 600ft dam across the Niagara River, which meant that 60,000 gallons of water that flowed ever second was diverted over the larger Horseshoe Falls which flow entirely on the Canadian side of the border. The dam itself consisted of 27,800 tons of rock, and on June 12, 1969, after flowing continuously for over 12,000 years, the American Falls stopped. Above: American Falls, then and now. [fark.]


Well This Is Something You Don’t See Every Day of the Day: A Connecticut man accidentally stumbled onto a shoebox containing a set of never-before-seen photos snapped by his in-laws from the time the U.S. Army Corp of Engineers turned off the water on the American side of Niagara Falls.

From the Daily Mail:

In June 1969, U.S. engineers diverted the flow of the Niagara River away from the American side of the falls for several months. Their plan was to remove the large amount of loose rock from the base of the waterfall, an idea which they eventually abandoned due to expense in November of that year. […]

To achieve this the army had to build a 600ft dam across the Niagara River, which meant that 60,000 gallons of water that flowed ever second was diverted over the larger Horseshoe Falls which flow entirely on the Canadian side of the border.

The dam itself consisted of 27,800 tons of rock, and on June 12, 1969, after flowing continuously for over 12,000 years, the American Falls stopped.

Above: American Falls, then and now.


http://thedailywh.at/post/2329088467/well-this-is-something-you-dont-see-every-day-of


Read more…

JPS & MWH Soft Complete Successful River and Drainage Modeling Seminars in Malaysia

Key Technology Seminars Attracted Many of the Country’s Top Drainage Engineers,
Highlighted Latest Innovations in Urban and River Modeling

Broomfield, Colorado USA, December 15, 2010 — MWH Soft, a leading global innovator of wet infrastructure modeling and simulation software and technologies, today announced the successful completion of the River and Drainage Modeling Seminar Series it co-presented in Malaysia. The seminars were co-organized by Jabatan Pengairan Dan Saliran (JPS) the Malaysian Government’s Department of Irrigation and Drainage and held in Kuala Lumpur and Penang on December 1 and 2.

JPS are responsible for flood management and main river water quality throughout Malaysia and have embarked on ambitious programs to update the national mapping inventory of historic flood extents, flood risks and associated flood hazards and restore the health and diversity of the country’s worst polluted rivers. Key to the success of these programs is adoption of advanced modeling and simulation techniques that allow detailed analysis of flood risk and flood hazard at the individual property scale and catchment-wide simulation of pollution to effectively support a comprehensive approach to flood risk management and environmental improvement.

These unique and informative events showcased the use of MWH Soft software products and services for the management and modeling of stormwater and flooding events. Close to 200 attendees learned about advanced engineering data management, the overall benefits of hydraulic and water quality modeling; advanced river modeling; integrated river, sewer and overland flow modeling (integrated catchment modeling); and real time flood forecasting.

Case studies of recently completed projects were presented to augment the technical product demonstrations. These presentations highlighted the benefits gained by use of advanced modeling over a wide range of applications including integrated stormwater and river flood modeling for development control; dynamic urban stormwater management for tidally affected towns; catchment wide 2D flood modeling to provide detailed predictions of the flood extends, depths, velocities and associated hazard; catchment wide flood forecasting and warning systems that use detailed hydrological and hydraulic models linked to real-time weather information to provide accurate predictions of the location and severity of impending flooding; and basin wide pollution modeling to investigate options for water quality improvement and priorities investment in treatment work throughout the river system.

Showcased products included:

InfoWorks ICM (Integrated Catchment Modeling) — the first truly integrated modeling platform to incorporate both urban and river catchments. Fully integrated 1D and 2D modeling techniques, give users the unprecedented power to simultaneously model both the below-ground and above-ground elements of catchments to accurately represent all flow paths and improve understanding of the processes occurring in the holistic environment. The state-of-the-art software can take into account interactions of natural-manmade environments and effectively simulate the water quality impact of polluting runoff and effluent from urban areas.

FloodWorks — a sophisticated flood warning system that links real-time hydrological and meteorological time-series data sources with detailed and accurate water models to provide forecasts of water level, flood depth and sea state for the hours or days ahead.

InfoWorks RS — an integrated software solution for simulating flows in channels and rivers and on floodplains that enables planners and engineers to carry out fast and accurate modeling of catchment, river and floodplain systems.

InfoWorks CS — an industry-leading software solution for urban drainage modeling. Its modeling environment is unequaled for achieving efficient and effective design and operational control of wastewater and stormwater network infrastructures.

“The turnout for these events was phenomenal,” reported Andrew Brown, MWH Soft Regional Manager for EMEA and Malaysian Operations. “We were able to demonstrate proven, cutting-edge software tools and state-of-the-art engineering techniques to a large and enthusiastic audience. Efficient and robust river and drainage systems are essential for a healthy and vibrant community. MWH Soft technology plays a critical role in the design, operation and maintenance of these vital systems. Every attendee came away from these seminars with new information they could apply immediately.”

Read more…

The Floridan Aquifer

A great image about the Floridan Aquifer from http://www.gohydrology.org/2010/12/submerged-sea.html
The Floridan Aquifer is a far ways down … Especially on the south peninsula where it’s buried a thousand feet.
But poke a hole in it with a pipe and its water flows straight to the surface, sort of like an artesian spring. As prodigious a water source as that sounds, ever so tempting to tap, don’t forget that it’s packed with a bunch of dissolved solids too.

Read more…

A Supercell Thunderstorm Cloud Over Montana

Astronomy Picture of the Day

Discover the cosmos! Each day a different image or photograph of our fascinating universe is featured, along with a brief explanation written by a professional astronomer.

2010 November 30
See Explanation. Clicking on the picture will download the highest resolution version available.

A Supercell Thunderstorm Cloud Over Montana
Credit & Copyright: Sean R. Heavey

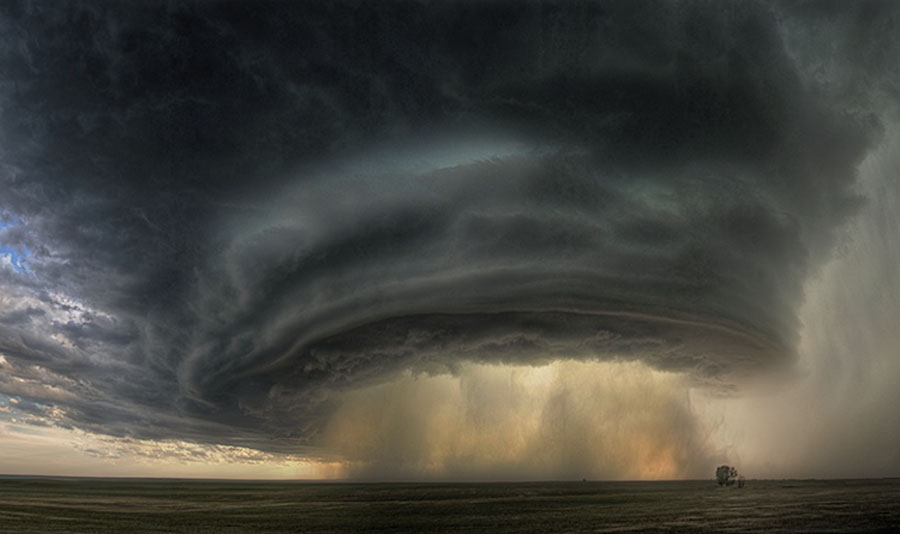
Explanation: Is that a spaceship or a cloud? Although it may seem like an alien mothership, it's actually a impressive thunderstorm cloud called a supercell. Such colossal storm systems center on mesocyclones -- rotating updrafts that can span several kilometers and deliver torrential rain and high winds including tornadoes. Jagged sculptured clouds adorn the supercell's edge, while wind swept dust and rain dominate the center. A tree waits patiently in the foreground. The above supercell cloud was photographed in July west of Glasgow, Montana, USA, caused minor damage, and lasted several hours before moving on.

http://antwrp.gsfc.nasa.gov/apod/ap101130.html

Read more…

Subject: Hysteresis Effect in the Link Flow versus Depth Relationship in SWMM 5


You can often get a hysteresis effect for the Flow versus Depth relationship in SWMM 5 due to the five component St. Venant equation used to simulate the flows (http://swmm5.blogspot.com/2010/12/what-are-units-for-five-st-venant-flow.html) . A hysteresis effect is having two or more flow values for the same depth value in the link. For example, this image shows how the link 8100 has a different flow for the same depth in the rising and falling limb’s of the hydrograph. This is due to the different values for the upstream and downstream head, hydraulic radius and cross sectional area during the falling and rising hydrograph, respectively.

Read more…

How is RHO Computed for a Link in SWMM 5?

Subject: How is RHO computed for a Link in SWMM 5?


SWMM 5 uses a sliding metric to calculate the cross sectional area and hydraulic radius used in the simulation for the link dynamic flow. The area and hydraulic radius used moves from the Upstream End of the Link to the Midpoint of the Link based on the Froude number and a few other considerations (see Figure 1 for the other considerations).


The area and hydraulic radius used as a function of the Froude Number:

1.Upstream cross sectional area and upstream hydraulic radius is used when the Froude Number > 1

2.Midpoint sectional area and hydraulic radius is used then the Froude Number is < 0.5

3.An area and hydraulic radius between the upstream and midpoint sections is used then the Froude Number is between 0.5 and 1

Figure 1: How to compute RHO based on the Froude Number.

Figure 2: The computed value of the Froude Number and the value of RHO over time.

Figure 3: Relationship between the upstream area, midpoint area and the actual area used during the simulation.

Read more…