I'm trying to find the format of runoff interface file so I can create one?
Thanks
I'm trying to find the format of runoff interface file so I can create one?
Thanks
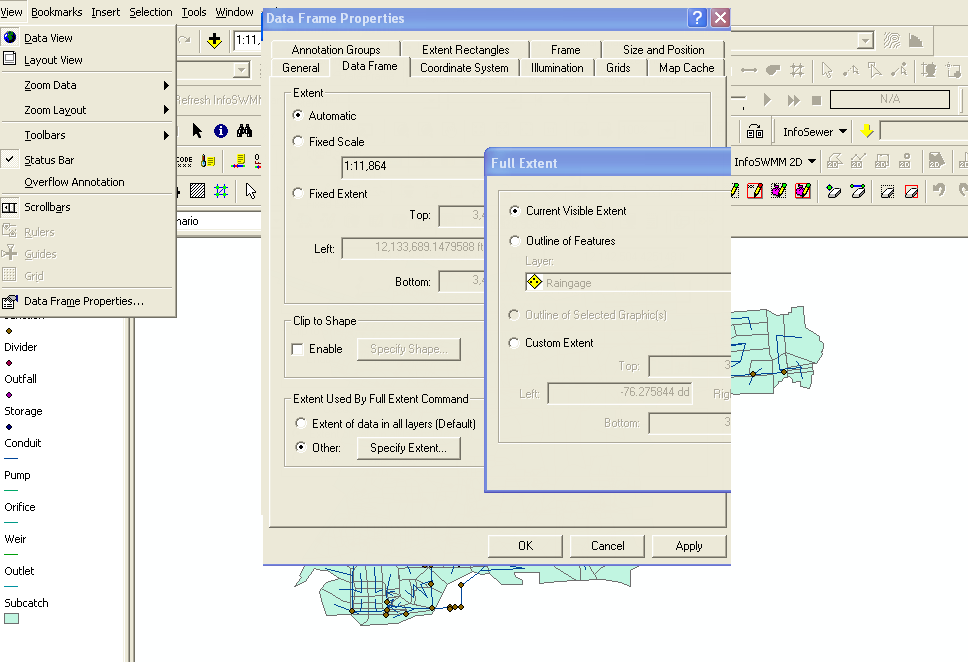
Problem: The network looks very small when you zoom out to the maximum extents of the window
Reverse flow in a link of SWMM 5 occurs if the downstream head is greater than the upstream head. The flow calculations for the link are based on the time step head, cross sectional area(s), hydraulic radius and old time step flow of the link. The only extra criterion for the link flow is the requirement that the flow cannot reverse during one iteration but must first become zero before being allowed to be negative if the old flow was positive or positive if the old iteration flow (qLast) was negative. This calculation is done in dynwave.c using the current iteration flow, q, the last iteration flow, qLast and the sign of the current iteration flow q. The requirement prevents the flow from oscillating sign during the iterative process in a time step.
In this example, a large flow from Upnode_2 causes a high head at node Middle which causes a reverse flow up link UpPipe1 to node UpNode_1. The image show here shows the flow in Link UpPipe1
if ( q * qLast < 0.0 ) q = 0.001 * SGN(q);

Subject: Two new parameters and a modified table in InfoSWMM 11 and H2OMAP SWMM that does the following:
1. Allows you to control the maximum number of iterations in the solution,
2. Controls the Stopping tolerance (units of feet) for node iterations, and
3. Shows not only the percent continuity error at a node but the error in million gallons (Mgal)
If you have a high continuity error or want to reduce your existing continuity error then you can increase the number of iterations or lower the stopping tolerance so that at each time step there is less continuity error.

Continuing its rapid expansion in Asia-Pacific and Europe, Innovyze, a leading global innovator of wet infrastructure modeling and simulation software and technologies, today announced that UIT Solutions. South Korea, and the SIS Group, Romania, have been named Certified Channel Partners for Innovyze’s water, wastewater and stormwater modeling and management software in their respective countries. These new channel partners will strengthen Innovyze’s ability to meet customer needs and to efficiently and effectively cover the entire process from customer acquisition to fulfillment and technical support in two of the world’s most rapidly growing markets.
UIT Solutions (www.uitsolutions.com) was founded in 1997 and has grown rapidly to become a leading provider of engineering software solutions and services in the Asia Pacific market. UIT’s services encompass various engineering disciplines and are supported by a dedicated team of technically qualified personnel with proven capabilities and state-of-art facilities. “Innovyze’s modeling and asset management tools are industry leading,” said Steve Kim, Chief Executive Officer of UIT Solutions. “By joining Innovyze as a certified channel partner, we can continue to provide solutions that meet our clients’ immediate demands and support their long-term goals.”
The SIS Group (www.sis.ro) is an information technology company founded in 1994. With 20 years of experience in the design, installation and maintenance of monitoring and process control systems, real time information systems and safety and security systems, SIS brings a wide range of technical skills to its role as an Innovyze certified channel partner. “As a company, we are always looking to partner with the most innovative and technologically advanced solution providers,” said Sandra Ionescu, Business Development Director for the SIS Group. “Innovyze leads the way not only in hydraulic modeling, but also in real-time solutions for both flooding and water distribution.”
“UIT Solutions and the SIS Group are terrifically strong additions to the Innovyze worldwide network of certified channel partners,” noted Paul F. Boulos, Ph.D., Hon.D.WRE, F.ASCE, President and Chief Operating Officer of Innovyze. “In addition to an excellent reputation, both organizations are committed to providing leading-edge technology supported by technical specialists. That closely aligns them with our goal of supplying the world’s wet infrastructure engineers with the very best solutions to meet their day-to-day needs. Their strength will be a great asset to help expand our customer base throughout South Korea and Romania.”
Published online 16 February 2011 | Nature 470, 316 (2011) | doi:10.1038/470316a
News
Likelihood of extreme rainfall may have been doubled by rising greenhouse-gas levels.
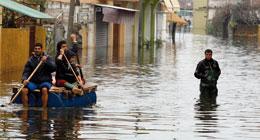 The effects of severe weather — such as these floods in Albania — take a huge human and financial toll.REUTERS/A. CELI
Climate change may be hitting home. Rises in global average temperature are remote from most people's experience, but two studies in this week's Nature1,2conclude that climate warming is already causing extreme weather events that affect the lives of millions. The research directly links rising greenhouse-gas levels with the growing intensity of rain and snow in the Northern Hemisphere, and the increased risk of flooding in the United Kingdom.
Insurers will take note, as will those developing policies for adapting to climate change. "This has immense importance not just as a further justification for emissions reduction, but also for adaptation planning," says Michael Oppenheimer, a climate-policy researcher at Princeton University in New Jersey, who was not involved in the studies.
There is no doubt that humans are altering the climate, but the implications for regional weather are less clear. No computer simulation can conclusively attribute a given snowstorm or flood to global warming. But with a combination of climate models, weather observations and a good dose of probability theory, scientists may be able to determine how climate warming changes the odds. An earlier study3, for example, found that global warming has at least doubled the likelihood of extreme events such as the 2003 European heatwave.
More-localized weather extremes have been harder to attribute to climate change until now. "Climate models have improved a lot since ten years ago, when we basically couldn't say anything about rainfall," says Gabriele Hegerl, a climate researcher at the University of Edinburgh, UK. In the first of the latest studies1, Hegerl and her colleagues compared data from weather stations in the Northern Hemisphere with precipitation simulations from eight climate models (see page 378). "We can now say with some confidence that the increased rainfall intensity in the latter half of the twentieth century cannot be explained by our estimates of internal climate variability," she says.
The second study2 links climate change to a specific event: damaging floods in 2000 in England and Wales. By running thousands of high-resolution seasonal forecast simulations with or without the effect of greenhouse gases, Myles Allen of the University of Oxford, UK, and his colleagues found that anthropogenic climate change may have almost doubled the risk of the extremely wet weather that caused the floods (see page 382). The rise in extreme precipitation in some Northern Hemisphere areas has been recognized for more than a decade, but this is the first time that the anthropogenic contribution has been nailed down, says Oppenheimer. The findings mean that Northern Hemisphere countries need to prepare for more of these events in the future. "What has been considered a 1-in-100-years event in a stationary climate may actually occur twice as often in the future," says Allen.
But he cautions that climate change may not always raise the risk of weather-related damage. In Britain, for example, snow-melt floods may become less likely as the climate warms. And Allen's study leaves a 10% chance that global warming has not affected — or has even decreased — the country's flood risk.
Similar attribution studies are under way for flood and drought risk in Europe, meltwater availability in the western United States and drought in southern Africa, typical of the research needed to develop effective climate-adaptation policies. "Governments plan to spend some US$100 billion on climate adaptation by 2020, although presently no one has an idea of what is an impact of climate change and what is just bad weather," says Allen.
ADVERTISEMENT

Establishing the links between climate change and weather could also shape climate treaties, he says. "If rich countries are to financially compensate the losers of climate change, as some poorer countries would expect, you'd like to have an objective scientific basis for it."
The insurance industry has long worried about increased losses resulting from more extreme weather (see 'Fatal floods'), but conclusively pinning the blame on climate change will take more research, says Robert Muir-Wood, chief research officer with RMS, a company headquartered in Newark, California, that constructs risk models for the insurance industry. "This is a key part of our research agenda and insurance companies do accept the premise" that there could be a link, he says. "If there's evidence that risk is changing, then this is something we need to incorporate in our models."
See News and Views p.344

Innovyze, a leading global innovator of wet infrastructure modeling and simulation software and technologies, today announced the worldwide release of Generation 11.5 of InfoWorks RS and FloodWorks, its class-leading river and floodplain modeling and real time flood forecasting solutions. The latest release adds significant customer-requested functionality to improve the simulation and management of the world’s river systems.
InfoWorks RS combines a highly advanced 1D and 2D simulation engine, data management, geographical analysis and a relational database in one environment. The result is a single tool that can import, clean up and store survey and time series data; build detailed and accurate models; analyze model results; and present outputs in graphical and engineering report-quality formats. InfoWorks RS provides full-solution modeling of open channels, culverts, floodplains, embankments and hydraulic structures. It also simulates rainfall runoff using both event-based and conceptual hydrological methods.
InfoWorks RS V11.5 now allows for stronger imports of HEC-RAS geometry file. Ineffective flow areas, obstructed areas, bridges, lateral weirs, gated spillways, and storage areas can now all be imported directly from HEC-RAS, simplifying the switch from HEC-RAS to InfoWorks RS. The new version also adds significant performance increases for both water quality and comprehensive two-dimensional (2D) simulations. For a complete listing of new features in InfoWorks RS V11.5, visit the “What’s New” section of innovyze.com online help.
FloodWorks is a modular software package focused on real-time simulation and forecasting of future hydrological and hydraulic conditions in river basins, stormwater and drainage systems and coastal areas. Designed for operational use in the control room, FloodWorks links a variety of live data sources with a wide range of models to provide detailed and accurate forecasts of water levels, flood depths, flows, velocities, water quality parameters and sea state. Using FloodWorks, managers and engineers can carry out fast, accurate and detailed simulations of the future effects of an extreme event, providing key data necessary to effectively deploy emergency response services and minimize the risk of loss of life and damage to infrastructure.
Enhancements in FloodWorks V11.5 include user-defined run timesteps, additional GRIB formats for radar rainfall data, improved graphing and labeling, strengthened validation, and significant performance gains for systems with a large number of status objects.
Subject: How to Model Avis and Avio Gates in SWMM 5
Link from Google Books
Every river system mapped in World of Rivers

The annual Malofiej awards, for top graphics in journalism, were handed out last week. The best map of 2010 went to National Geographic for the World of Rivers. Every river system in the world was mapped and scaled by annual discharge.
We live on a planet covered by water, but more than 97 percent is salty, and nearly 2 percent is locked up in snow and ice. That leaves less than one percent to grow our crops, cool our power plants, and supply drinking and bathing water for households.
Showing everything doesn't always work with so much data, but it does in this case. It reminds me of Ben Fry's All Streets. See the full-sized interactive version on National Geographic.
Also, congratulations to National Geographic for winning the Peter Sullivan award (best in show) for their map of the oil spill in the Gulf of Mexico and The New York Times for their work on how Mariano Rivera dominates, print and online, respectively.


 |
|||||
|
|
|||||
|
Broomfield, Colorado USA, March 27, 2011 — MWH Soft is pleased to announce it has a new name, Innovyze. The new name and logo more accurately reflect the company’s rich history of creating innovative, technically advanced modeling and management solutions for the world’s water and wastewater communities.
“The name Innovyze brings together the best characteristics of innovation and analyze, which is represented in our combined organization. It means to introduce something new and to change, while carefully identifying key factors and possible results,” said Paul F. Boulos, Ph.D., Hon.D.WRE, F.ASCE, the company’s President and COO. “Although our name is changing, our people, products, and passion are still focused on our core mission: innovating for sustainable infrastructure.” As part of the introduction of the Innovyze name, the company has an updated website at www.innovyze.com and is hosting its first public event, the 2011 Asia Pacific Water and Sewer Systems Modelling Conference, beginning March 30 in Gold Coast, Australia. For additional information regarding the change, visit www.innovyze.com/newname. About Innovyze |
|||||
FromSmart Planet
![]()

An American environmental scientist has been named the 2011 Stockholm Water Prize laureate.
Stephen Carpenter, a professor of zoology and limnology at the University of Wisconsin-Madison, was recognized by Sweden for his research demonstrating how lake ecosystems are affected by the surrounding landscape and by human activities.
His research on trophic cascades in lakes — a concept that describes how impacts to any species in an ecosystem will cascade down, or up, the food chain — has informed how concrete can be used to manage lakes.
Specializing in ecology, the 59-year-old scientist “reframed our understanding of freshwater environments and how lake ecosystems are impacted by humans and the surrounding landscape” by combining theoretical models and large-scale lake experiments.
Specifically, Carpenter’s work helps us understand how we affect lakes through nutrient loading, fishing, and introduction of exotic species, the award committee said.
“Professor Carpenter has shown outstanding leadership in setting the ecological research agenda, integrating it into a socio-ecological context, and in providing guidance for the management of aquatic resources,” a Stockholm International Water Institute committee said in a statement.
H.M. King Carl XVI Gustaf of Sweden will present the prize – $150,000 and a crystal sculpture specially designed by Orrefors – to Carpenter at a royal award ceremony during World Water Week in Stockholm on August 25.
The announcement coincides with World Water Day, held on March 22 for the last 18 years.
|
Australia’s City West Water Expands Investment in MWH Soft Solutions For Enterprise-Wide Geospatial Water Modeling
Selection Makes MWH Soft Solution of Choice for All Melbourne State-Owned Water Retailers
|
||||||
|
Broomfield, Colorado USA, March 22, 2011 — MWH Soft, a leading global innovator of wet infrastructure modeling and simulation software and technologies, today announced that City West Water Limited (CWWL), Australia, has awarded MWH Soft a substantial contract for its premier InfoWorks WS water modeling software. With this selection, all three of Melbourne’s state-owned metropolitan water retailers rely on MWH Soft for comprehensive wet infrastructure modeling and management solutions. The program, chosen following a competitive review to replace its existing modeling solution, will support CWWL’s commitment to improving its operational efficiency while taking its customer service to new levels. CWWL provides drinking water, sewerage, trade waste and recycled water services to over 855,900 people in Melbourne’s central business district, inner and western suburbs. Its boundaries extend to Brimbank, Hobsons Bay, Maribyrnong, Melbourne (north of the Yarra River), Moonee Valley, Wyndham, Yarra and parts of Melton and Hume. The company’s water network consists of 4,431 kilometers of water mains, ten pumping stations, eight service reservoirs and tanks, and four secondary chlorination plants, supplying more than 80 billion liters of water each year. Its sewerage system consists of a network of more than 3,909 kilometers of sewer pipes. CWWL is currently using MWH Soft InfoWorks CS for its wastewater modeling needs. Bruce Collins, Planning Manager for CWWL, commented, “The MWH Soft InfoWorks WS software is ideal for our needs at CWWL. The breadth and depth of the software modeling capabilities coupled with its remarkable ability to handle large and complex systems and its dependable local support make the MWH Soft solution unique in addressing our current and future design and analysis needs and creating superior customer value.” Around the world, high quality all-mains InfoWorks WS models enable utilities to make informed planning, design and management decisions with confidence by giving them an accurate view of their drinking water distribution systems’ performance. This information — including water quality, supply, demand and infrastructure problems and investigations of remedial measures — allows them to provide a sustainable supply of high quality water at an acceptable pressure and flow rate to commercial, industrial and domestic users while minimizing loss through leakage. As part of the MWH Soft advanced workgroup modeling management platform, InfoWorks WS is built to handle very large and complex models and allow robust multi-user collaboration. |
The Red River in Minnesota flows backwards in its channel, in a northerly direction. Its course is backwards not because it’s going north (many people in America do think that rivers flow south), but rather, because its channel is part of a larger channel that historically carried more water than any other river on this planet has ever carried. This was the Warren River, which emptied Lake Agassiz (the largest fresh water lake ever) via the Red River Valley, then on to the Minnesota River Valley, then to the Mighty Mississippi. Much mightier then.
Now, the Red River flows north into Lake Winnipeg, which ultimately links to Hudson Bay. It forms the border between North Dakota and Minnesota, passing by Fargo (the very same Fargo that had nothing to do with the Coen brothers’ film of the same name). This region gets a lot of snow some years, and when there is a lot of snow and a quick warm-up in the spring, the river carries quite a bit of extra water. This happens often enough that it is rarely a surprise but nothing close to every year. The flooding, in turn, often causes a great deal of property damage and threatens people’s well being.
We are now seeing thousands of people loading up tens of thousands of sandbags to produce miles of instant levee in the hopes of keeping the river back.
You would expect that if a river floods like this now and then, either people would not live in the flood zones, or the river would be capable of carrying more water. Well, both of those are true, and both of those are in process.
On the people side: People have lived in this valley for about 10,000 years (one of the oldest human skeletons in North America is from a nearby site), and it is almost certain that most of those people, most of the time, knew to avoid the flood zones in the spring. But more recently, different people showed up and they had less experience here. They built towns and eventually cities in the flood plain. Then they got flooded but had already built homes and buildings and roads and stuff. So they rebuilt some things, and in other cases moved, and have slowly improved anti-flooding technologies. Over time, the process of the people of the Red River Valley getting out of the way (and to a smaller extent, adapting to or diverting the floods) will be complete. This will probably take another 100 years. So, that process will have been about a two-century-long process, or about ten generations.
Which would be remarkably fast for humans.
On the river side of it, the river is actually moving an incredible amount of water in an incredibly short time considering that it is essentially flowing upstream. Well, okay, technically it is not really flowing upstream (that would be impossible), but the giant river channel that the Red River flows in is not carved into the landscape to move water north. It is carved into the landscape to move water south. But over the last days of its flow in ancient times (in geological terms, so maybe decades? centuries?), the giant Warren River slowed down its flow and the river channel filled with sediment and clogged up. Whatever rivers are now flowing up (the Red) or down (the Minnesota) this channel of the once greatest river ever are tiny trickles running in irrelevant directions on the top of this sediment.
In other words, the Red River, though it flows in an ancient channel, is pretty much a brand new river on a brand new landscape. In no time at all, the Red River will cut its channel clear of sediment and start eroding into the parent rock, and it will eventually form a deep and wide channel that will easily contain any amount of snow melt.
I’m guessing about ten thousand years. Maybe twenty. But not more than twenty five, anyway.
Source http://quichemoraine.com/2009/03/young-river-in-old-valley/
http://www.nature.com/nclimate/journal/vaop/ncurrent/full/nclimate1059.html
Science Daily Description
The research team and Ipsos-MORI surveyed 1,822 members of the British public to test whether personal experience of flooding had affected perceptions about climate change. They also looked at whether those perceptions would affect respondents' intentions regarding energy use. The study revealed that people who reported flooding experiences had significantly different perceptions of climate change, compared to those who had not experienced flooding. These perceptions were, in turn related to a greater preparedness to save energy. In particular:
- Those who reported flooding in their local area were more likely to be concerned about climate change, to perceive a greater local vulnerability to its impacts, and also felt more able to have an impact (perceived instrumentality) over the issue.
- Flooding experiences were also linked to lower levels of uncertainty regarding the existence of climate change
- Perceived instrumentality, concern, and perceived local vulnerability were found to mediate the relationship between flooding experience and preparedness to reduce energy use.
 |
| Figure 1. Equations for the Node Time Step. |
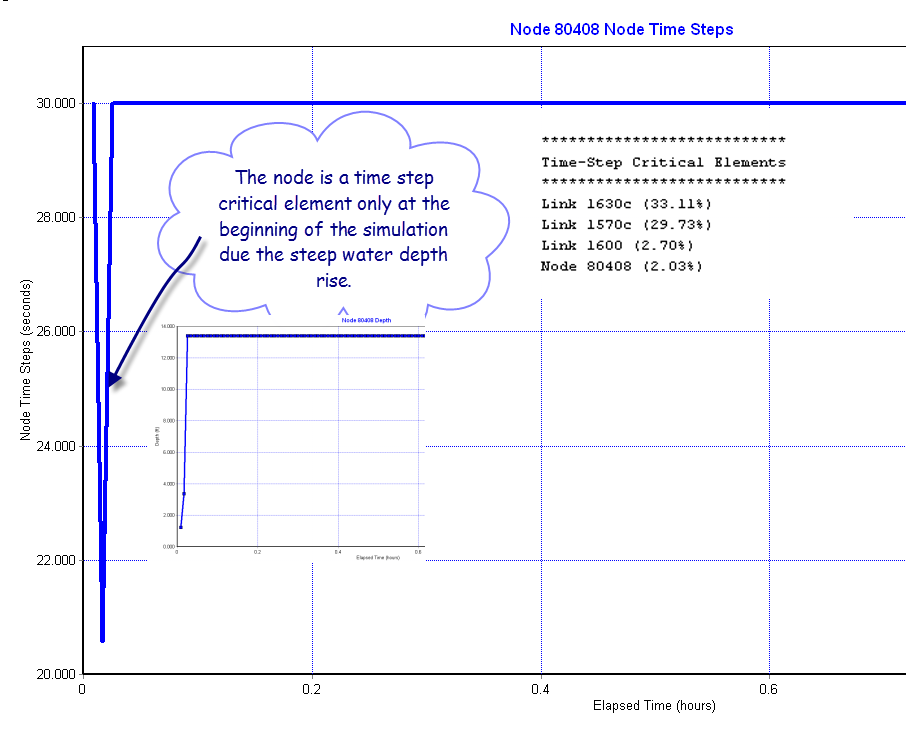 |
| Figure 2. Node Time Step is critical at the beginning of the simulation. |
| Understanding Pump Fundamentals for an Energy Efficient World (Part Four) |
| Written by Hydraulic Institute Members and Pump Systems Matter Sponsors |
|
Editor's Note: This is the fourth part of a series based on Optimizing Pumping Systems: A Guide to Improved Energy Efficiency, Reliability, and Profitability, written by pump systems experts. This new guidebook continues the mission of Pump Systems MatterTM and the Hydraulic Institute to advance knowledge on pumping systems. Click here for Part 1, Part 2, Part 3, Part 5 and Part 6 Pumping systems are used worldwide to transport fluids and operate in most industrial processes. Commercial and residential buildings also rely on pumps for essential services. Pumping systems account for nearly 25 percent of the energy consumed by electric motors, and for 20 to 60 percent of the total electrical energy usage in many industrial, water and wastewater treatment facilities. Figure 1 shows the potential saving in gigawatt hours per year for optimization opportunities in key energy intensive industries.
The process of identifying, understanding and effectively eliminating unnecessary losses while reducing energy consumption, improving reliability and minimizing the cost of ownership over the economic life of the pumping systems is commonly referred to as systems optimization. Besides reducing energy costs, improving the performance of an existing pumping system yields other benefits (see Table 1).
|
|
Last Call for Registrations: 2011 Asia Pacific Water and Sewer Systems Modeling Conference
Additional Keynote Speaker and Cooperating Organization Announced
|
||||||
|
Broomfield, Colorado USA, March 8, 2011 — MWH Soft, a leading global innovator of wet infrastructure modeling and simulation software and technologies, today announced the addition of Dan Spiller, Director of Operations, SEQ Water Grid Manager, Australia, as keynote speaker and the American Academy of Water Resource Engineers as a cooperating organization for the fourth annual Asia Pacific Water and Sewer Systems Modeling Conference. Last call has been issued for registrations to the event, widely considered to be the most comprehensive and significant infrastructure modeling, design and management technology conference of its kind. The event will be held March 30-31, 2011, at the Hotel Grand Chancellor Surfers Paradise Resort, on Australia’s Gold Coast. Seats are limited and attendees are encouraged to register immediately. The Asia Pacific Water and Sewer Systems Modeling Conference, organized by MWH Soft, is a once-a-year learning opportunity for the Asia Pacific modeling community. It brings together a wide array of water and wastewater technical experts and their managers looking to sharpen their skills, expand their knowledge, and share best practices with their peers. The theme of this year’s conference is “Using advanced modeling technology to enhance planning, operation and asset management.” During the two days of content-rich gatherings, participants will learn how to gain a competitive edge in this difficult economy by designing, operating and managing better and more cost-effective systems, protecting the environment, and safeguarding public health. Newly added keynote speaker Dan Spiller joined the SEQ Water Grid Manager team as Director of Operations in July 2010. He had previously served as acting Executive Director of the Queensland Water Commission. Mr. Spiller was the principal author of the South East Queensland Water Strategy and was directly responsible for policy and communications regarding the development and use of purified recycled water schemes in South East Queensland. He has previously been involved in infrastructure planning and assessment at Brisbane City Council, the Queensland Competition Authority and the Office of Urban Management. He holds Master of Professional Economics, Master of Urban and Regional Planning and Bachelor of Built Environment degrees. The conference will also feature unique technical presentations showcasing projects from throughout the region, including additional keynote addresses from industry leaders Dr. Paul F. Boulos, President and COO, MWH Soft, United States; and Dato’ Ir Ahmad Husaini Sulaiman, Director General, Department of Irrigation and Drainage, Malaysia. Other highlights include a look at twenty-three state-of-the-art, real-world situations, personally presented by experts from utilities and engineering consulting firms. Through them, participants will learn about increasing water network levels of service; the protection of investments through improved asset management; advanced sewer modeling; integrated catchment modeling; sophisticated river and flood modeling; operational modeling and transient analysis of water networks; opportunities and challenges facing water utilities; and using hydraulic models to understand sewer networks. An interactive forum will provide useful industry insights and an opportunity to share cutting-edge information, proven strategies, cost-effective solutions and best practices with water and wastewater industry movers and shakers. The forum will also allow industry professionals to explore new ways of using engineering GIS technology and advanced hydraulic modeling, asset management and information management applications. Attendees will learn how they can leverage these tools to do their jobs better, easier, faster and more efficiently, maximizing their return on software investments and helping their organizations become more globally competitive. Participants will also earn valuable Continued Professional Development (CPD) hours. The agenda also includes business implementation and management issues, technology updates, industry solutions presentations, and social and networking events. “This unique and inspirational event gives our users a fantastic opportunity to learn about the latest developments in water and wastewater infrastructure engineering and management,” said Boulos. “Attendees can carry this valuable learning experience back to their organizations, opening new avenues for increasing productivity and performance, enhancing project quality, maximizing return on their software investments, gaining a competitive edge on the future, advancing their careers, and improving the quality of life in their communities.” This year’s conference is sponsored by Global Water Partnership Southeast Asia, SEAWUN, Singapore International Water Week, Water Malaysia 2011, PWWA, Manila Water, Taipei Water Department, Institute of Water Modelling, Queensland Urban Utilities, Melbourne Water, WaterCare, Wide Bay Water, Southern Water, Tweed Shire Council, Tauranga City, Byron Shire Council, Marlborough District Council, Riverina Water, and GWM Water. |
From Smart Planet "In 20 years, water demand will exceed supply by 40 percent"
It takes so much water to make everything we produce and own. The hidden use of water is known as virtual water. Nearly 90 percent of the consumption of the world’s fresh water supply is used for producing food and energy.
You might not realize this but it takes 1.5 tonnes of water to make a computer and six tonnes to make a pair of jeans. So it’s not surprising that the annual global virtual water trade is the equivalent of 10 Nile Rivers.
Water regulates climate, predominately storing heat during the day and releasing it at night. Water in the ocean and atmosphere carry heat from the tropics to the poles. The process by which water moves around the earth, from the ocean, to the atmosphere, to the land and back to the ocean is called the water cycle.