Subject: InfoSWMM and Arc GIS Layer Properties for Surcharge and Flooded Time
An important advantage of using InfoSWMM is the ability to use all of the Arc GIS layer and programming tools. For example, you can graph the model results for the flooded and surcharged time in a node using a Bar/Column plot to show the surcharge time in the node and the flooded time in the node. A flooded node is always considered to be surcharged but a surcharged node does not always flood. The surcharge level is any water surface elevation above the highest connecting crown elevation but the flooded time is a water surface elevation at or exceeded the rim elevation of the node.
Subject: InfoSWMM and Arc GIS for Create Graphs Using Network Data and Model Results
An important advantage of using InfoSWMM is the ability to use all of the Arc GIS layer and programming tools. For example, you can graph the model results in Bar, Pie, Scatter, Bubble or other types of Graphs once the model data and model result layers are Joined together. The image below shows a thematic mapping for Node Flooding, Conduit Force Main Type and a Pie and Bar Chart of Node Flooding Time and the Q Full in the links, respectively.
Subject: InfoSWMM and Arc GIS Layer Properties for Force Mains and Gravity Mains
An important advantage of using InfoSWMM is the ability to use all of the Arc GIS layer and programming tools. For example, you can use the layer properties in the Table of Contents to color and create symbols for the force mains and gravity mains in InfoSWMM. The Force Main variable (which is a Yes/No parameter) is selected as the field value in the Symbology Tab of Layer Properties which allows you to color and size the link based on the Force Main property of is you do a Layer Join the link property and simulation results.
New York City Expands Hydraulic Modeling with InfoWorks CS
The United States’ Largest Utility Continues to Look to Innovyze Solutions to Manage Its Wastewater Collection System
Broomfield, Colorado, USA, June 14, 2011
Innovyze, a leading global innovator of wet infrastructure modeling and simulation software and technologies, today announced that New York City Department of Environmental Protection (NYCDEP) has broadened its application of Innovyze technology with expanded usage of InfoWorks CS. The expansion will give NYCDEP greater access to the most widely used, fastest, and most accurate collection system modeling and management application in the industry. The news also underscores Innovyze’s position as a leading supplier of technology to the world’s largest water utilities.
NYCDEP’s extensive wastewater treatment system comprises over 7,400 miles (12,000 km) of sewer pipes, 135,000 sewer catch basins, over 495 permitted outfalls for the discharge of combined sewer overflows (CSOs), and 95 pumping stations that transport wastewater to 14 treatment plants throughout the New York City’s five boroughs. The system processes 1.3 billion gallons (4.9 billion liters) of wastewater per day.
InfoWorks CS allows engineers and planners to produce fast, accurate and robust fully dynamic hydraulic modeling of any complex urban collection system network. This encompasses full modeling of backwater effects and reverse flow, open channels, trunk sewers, complex pipe connections and ancillary structures.
An essential tool for identifying and justifying cost effective infrastructure improvements, InfoWorks CS also provides a practical method for operational control, including real time control, of the wastewater network. Other applications include urban flooding and pollution prediction and the modeling of water quality and sediment transport throughout the network. Offering exceptionally fast and stable simulations, InfoWorks CS facilitates the swift modeling of total networks or any sub-network. Users may simulate models of up to 100,000 nodes with confidence that the results will be as accurate as those for far smaller models—making it a leading choice for the world’s largest wastewater utilities.
Subject: Detention Pond Infiltration and Evaporation Losses
You can also add a storage pond infiltration and surface evaporation losses to the pond. The surface evaporation is added to the infiltration (computed from the green ampt parameters); a storage volume summary listing the average and maximum volume and the percent loss from the combined infiltration and evaporation from the ponds. The pond infiltration loss during a time step is basd on the areal weighed average depth, the Green Ampt infiltration and the Area of the pond.
What are the basic elements of a detention pond in SWMM 5? They are common in our backyards and cities and just require a few basic elements to model. Here is a model in SWMM 5.0.022 that even has a fountain in the real pond – which we not model for now. The components of the model are:
1. An inlet to the pond with a simple time series – a subcatchment can be added to it in a more complicated model but for now we will just have a triangular time series,
2. A pipe to simulate the flow into the pond from the inlet,
3. A Storage Node to simulate the Pond that consists of a tabular area curve to estimate the depth and area relationship,
4. A Storage Node to simulate the Outlet Box of the Pond
5. Two Small Rectangular Orifices to simulate the low flow outflow from the pond at an elevation less than the weir
6. A large rectangular orifice to simulate the normal inflow to the Box
7. A rectangular weir to simulate the flow into the box when the pond water surface elevation is above the box
8. The outlet of the Box is a circular link with a Free outfall as the downstream boundary condition
9. The flow graph in the image shows the flow into the box starts from the two small orifices, next from the large orifice and finally from the top of the box or the weir.
Note: Steady State InfoSewer solution solves for the link flow and node heads
Here is an example of how the Steady State InfoSewer solution solves for the link flow and node heads or depths:
• 1st Flow is computed in each link and d and d/D is calculated based on pipe flow and manhole loading data and not the adjusted data from the 2nd pass.
• 2nd InfoSewer adjusts the link depth based on the manhole head and lists the adjusted depth in the browser and the Report Table after the manhole depths are calculated from downstream to upstream in the network.
• Result: The HGL graph shows the link d and d/D based on pipe flow not the adjusted depth so you are looking at the results of the 1st pass in the links and the 2nd Pass in the Nodes in a HGL Plot for a Steady State Simulation.
Here is one example of this sequence of events: The downstream head at the outfall causes a backwater condition in all of the links. The d/D and q/Q is based on the manhole loading flow in the 1st pass and indicates the pipe is NOT full. However, in the 2nd Pass where the manhole depths are calculated from downstream to upstream the effect of the downstream boundary condition is felt. The head shows that there is a full downstream boundary condition which is reflected in the condition of backwater and in the adjusted depth value. The links are now full and the full depth is reflected in the value of the adjusted depth and the graphical presentation.
How to interpret this result:
1. Based on the manhole loading to the network the pipes are NOT full which is indicated by the value of d/D and q/Q, however
2. Based on the head calculations which account for downstream boundary conditions the pipes are full due to the backwater effect. The backwater condition is reflected in the value of the adjusted depth – the adjusted depth shows the pipe to be full.
Figure 1. Backwater is caused by the downstream boundary condition and shows full pipes but d/D is less than 1 based on the 1st Pass Link Flow Values.
Figure 2. InfoSewer solves for the flows in the links in the 1st pass and the heads at the nodes in the 2nd pass for the Steady State solution.
Figure 3. Pipe Summary Table Shows the Pipe Adjustments based on 2nd Pass Head calculations and the d/D and q/Q values from the 1st Pass Link Flow Calculations.
Figure 4: Two Pass Solution for InfoSewer (1) Flow and (2) Head
A new website called Cal-Adapt.org collects peer-reviewed climate change research to make the data available to people concerned about their local climate, decision-makers and experts. The website is interactive, so you can go in and use the tools to see how snow pack or temperature changes will impact the state of California by the end of the century.
I clicked on view local profiles to explore climate projections for San Francisco, and the map showed me this (pictured above):
You are now viewing the projected change in annual average temperatures across California under a a2scenariolow carbon emissions scenario (B1). The map above shows the projected difference in temperature between a baseline time period (1961-1990) and an end of century period (2070-2090).
Soon, the community feature will allow you to ask questions to a climate expert. The site has built-in social media functions, so if you “like” a map and want to share it, you can spread it through Facebook, Twitter or email. The scientific data is presented in a digestible, visual way. It’s a tool government agencies and city planners can use to make decisions about climate change risks.
“Cal-Adapt currently synthesizes 150 years of climate data generated from a variety of models and scenarios for carbon emissions. This gives users an opportunity to explore a wide range of possible outcomes given different potential social and economic factors,” Berkeley’s Brian Galey said in a statement.
I tried out another tool, which told me which areas are most vulnerable to a 100-year flood event as sea level rises. Global models have shown that the Golden State might see a 140 cm rise in sea level this century. As you can see, the areas near the coast are vulnerable to flooding:
“These are issues where we should have a logical public debate and it’s completely intolerable that people be subjected to this sort of abuse and to threats like this,” Dick Young, the ANU vice-chancellor, told the Telegraph.
Note:How to Understand the OUT directory in InfoSWMM and H2OMAP SWMM
This is how you understand the files in the .OUT directory:
.OUT OUT directory of the InfoSWMM project
Scenario Location of all Scenario Output Files
Base The Base Scenario in this case
JOB The temporary output file for inp, out and txt files during the simulation – this should be cleaned outand copied at the end of the simulation
HYDQUA Header.html is the left side of the browser page
HYDQUA.html is the text output file from SWMM 5
HYDQUA.inp SWMM 5 “like” input file for InfoSWMM
HYDQUA.out Binary Output File
hydqua.rpt.lid.txt LID Text Output File
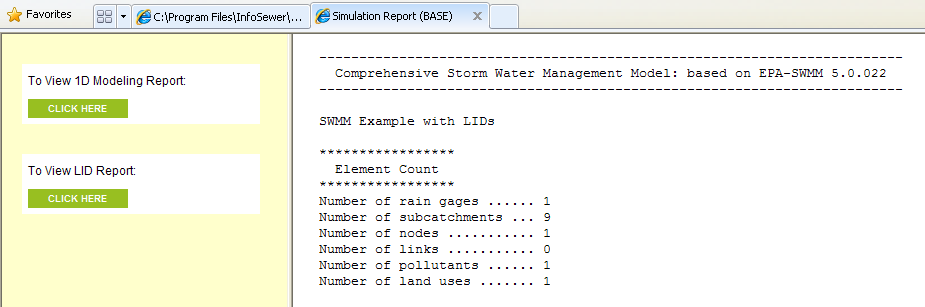
hydqua.rpt.txt InfoSWMM Text Output Comprehensive Storm Water Management Model: based on EPA-SWMM 5.0.022
If you have an data abort in some of the older InfoSWMM models the txt and inp files are still in the JOB directory and NOT the BASE directory. They can still be viewed in the JOB directory using the Notepad icons and searching for the files.
HYDQUA.html, HYDQUA Header.html and hydqua.rpt.txt together in the browser.
Philadelphia Water Department Selects CapPlan Water
Leading Risk-Based Water Infrastructure Capital Planning Package to Help Optimize
Rehabilitation and Renewal Spending
Broomfield, Colorado USA, May 24, 2011 — Innovyze, a leading global innovator of wet infrastructure modeling and simulation software and technologies, today announced that the Philadelphia Water Department (PWD), PA, has selected Innovyze CapPlan Water as its drinking water infrastructure management and risk assessment solution. The purchase equips PWD with a full range of high-performance performance modeling and condition assessment capabilities to help strengthen and optimize its water infrastructure and keep it operating efficiently well into the future.
PWD, which began water system service in 1801, supplies water to the City of Philadelphia (130 square mile service area), and portions of Montgomery, Delaware and Bucks Counties. The system serves over 1.7 million people through approximately 3,200 miles of mains, three water treatment plants and 15 pumping stations, and provides fire protection through more than 25,000 fire hydrants.
“CapPlan Water gives us the advanced asset performance modeling and risk assessment tools we need to optimize rehabilitation and renewal planning for our water system,” said James M. Brady, P.E., Chief of Water Conveyance for PWD. “The software’s comprehensive capabilities will help us refine our capital improvement plan to provide maximum benefit for the lowest cost and continue to best serve our customers.”
CapPlan Water changes the way water utilities plan the relative phasing of system improvements by allowing them to assess both the probability and consequence of failure for each asset. Assets that affect system operation will normally rate high on the consequence scale, while assets in poor condition will have a high probability of failure. In addition to refinements throughout, the latest release adds the ability to make consequence or likelihood of failure calculations based on GIS field, using virtually any mathematical function. This gives utilities the unique ability to directly apply any custom-developed methodology to their capital planning processes.
Probability of failure is determined based on the pipe’s physical condition (structural integrity, age, material, roughness factor, leakage/break/defect history) and location (proximity to a seismic fault or construction zone) as well as its hydraulic performance characteristics (head loss, pressure, velocity). Consequence of failure draws on data such as water outages (schools, hospitals, critical care facilities); low- and no-water conditions; reduced fire protection capabilities; flooding, including structural damage and impacts of chlorinated water in natural waterways; degradation of water quality; and other factors.
CapPlan Water calculates the risk of each asset linearly (consequence score multiplied by probability score), using either a bi-directional distribution matrix or a more complex multi-criterion classification. This choice of calculation methods gives water utilities unprecedented flexibility in defining risk based on virtually any combination of supporting data. The greatest attention can then be given to water mains at highest risk. With this evaluation in hand, utilities can create fully prioritized short- and long-term water main rehabilitation, replacement, maintenance and management plans and develop sound, cost-effective capital programs to support them. The program’s intuitive interface; easy-to-use functionality; and rich analytical, graphing and reporting capabilities save utilities considerable resources. With minimal effort, users can quickly pinpoint assets at the greatest risk of hydraulic and water quality deficiencies or structural failure, identify the best possible improvement alternatives for optimal system performance, prioritize improvements based on available budget, and realize significant cost savings.
1. 32 bit or 64 bit solution engine based on SWMM 5.0.022 selected using the Tools/Preferences/Operation Settings command
2. Number of dynamic solution threads for parallel processing selected using the Run Manager,
3. Single or batch runs selected using the Run Manager, and
4. DLL or the Simulation Task Manager using the Tools/Preferences/Operation Settings command.
You have control over the type of engine, the number of threads, the number of runs and whether the run is started right now or scheduled to run later or in batch mode.
CapPlan Sewer Version 6 Provides More Advanced Decision Support Tools to Optimize Sewer Rehabilitation and Renewal Spending
Broomfield, Colorado, USA, May 17, 2011
Delivering on its customer-centric approach to wet infrastructure modeling and management applications, Innovyze today announced expanded asset management capabilities for its industry-leading CapPlan Sewer. Leveraging users’ feedback, enhancements in V6 generation of the best-in-class asset performance modeling solution strengthen criticality analysis, CCTV video review, analysis and scheduling, and workflow flexibility for complex rehabilitation planning and budgeting.
Many of the world’s wastewater collection systems are reaching or have exceeded their design lives and urgently need extensive upgrading through rehabilitation, repair, and/or replacement. As aging systems deteriorate, they become increasingly vulnerable to structural failures and are plagued by excessive leaks, drops in carrying capacity, poor water quality, and service disruptions. Age-related infrastructure failures are often unexpected and catastrophic, resulting in significant service disruptions, flooding, and local area damage. The only financially responsible solution is to create well-engineered, risk-based capital improvement plans. Since 2007, Innovyze’s CapPlan product line, CapPlan Sewer and CapPlan Water, has been the leading software choice of utilities faced with creating such plans and optimizing their infrastructures.
CapPlan Sewer allows utilities to plan system improvements by scoring both the probability and consequence of failure for each underground asset. The assets that have the greatest likelihood of failure and the greatest consequences associated with the failure will be the most critical. Probability of failure is determined based on the pipe’s physical condition and location as well as its hydraulic performance characteristics. Consequence of failure ranking draws on data such as service to critical facilities, total flow carried, population served, adjacent vehicular traffic, and other related geospatial factors. Assets that affect system operation normally rate high on the consequence scale, while assets in poor condition have a high probability of failure.
Able to run on either the ArcGIS-based InfoSWMM or stand-alone H2OMAP platform, CapPlan Sewer tackles the toughest data integrity and processing issues that slow typical large-scale asset management analysis projects. Leveraging the unique CapPlan Sewer architecture, users can seamlessly work between hydraulic modeling calculations and traditional GIS data to determine probability and consequence scores without cumbersome, error-prone exports and data synching to other applications. CapPlan Sewer also gives wastewater utilities the unique ability to directly view, analyze and score CCTV defect data and video footage, eliminating the need for specialized third-party viewing software.
Key new features in V6 include: new fully customizable flowchart for generating a rehabilitation plan with an enhanced budget-driven planning tool, new bi-directional risk matrix calculations with expanded risk report, additional rehabilitation methods and user-specified cost tables, PACP quick ratings computation, and dozens of new and enhanced data query and graphical display capabilities.
“A strong asset performance modeling and capital planning strategy is critical for every wastewater utility,” said Paul F. Boulos, Ph.D, Hon.D.WRE, F.ASCE, President and COO of Innovyze. “By helping utility managers make better decisions on when to repair, replace, or rehabilitate their critical assets and develop a long-term funding strategy for these projects, Innovyze CapPlan helps them ensure the long-term sustainability of their utilities as well as their ongoing ability to deliver the required level of service. The enhancements in this latest release further strengthen the leading capabilities of CapPlan, making our users more productive and effective managers of their assets.”
1. The following fixes and updates were made to the LID
module of the code (lid.c):
a. The Drain Delay time for a Rain Barrel LID is now
correctly converted internally from hours to seconds.
b. The meaning of the Conductivity property of an LID's
Storage layer has been changed. It is now defined as
the saturated hydraulic conductivity of the native soil
below the layer instead of the conductivity of the layer
itself.
c. Storage layers are now optional for Bio-Retention Cells
and Permeable Pavement LIDs by allowing the layer height
to be zero. One should still enter a non-zero conductivity
for the layer if infiltration into native soil is allowed.
d. If the top width of the overland flow surface for an LID
is zero then any excess water above the surface storage
depth simply spills out instantaneously.
e. The calculation of infiltration in a Vegetative Swale
was corrected so that a swale with vertical sides will
produce the same results as a fully pervious subcatchment
with the same dimensions, roughness, and slope.
f. The water initially stored in all LID units is now reported
in the Status Report's Runoff Continuity table.
g. Error messages are now generated if the surface layer
vegetation volume fraction is less than 1, if the area of
all LIDs in a subcatchment is greater than the total area
or if the total capture area of all LIDs is greater than
the subcatchment's total impervious area.
2. Missing values for accumulation periods within an NWS rain
file are now processed correctly. See rain.c.
3. A new error message (318) is now generated if a user-prepared
rainfall file has its dates out of sequence. See rain.c, err.h,
and err.c.
4. Evaporation during wet time periods was including rainfall and
run-on as moisture available for evaporation when it should
only be the current ponded depth. See subcatch.c.
5. Curve Number infiltration was modified to use only direct
precipitation, not including runon or internally routed flow,
to compute an infiltration rate. See infil.h, infil.c,
subcatch.c and lid.c.
6. A new error message (110) is now generated if the ground
elevation of a subcatchment is less than the initial water
table elevation of its groundwater aquifer. See gwater.c,
err.h, and err.c.
7. A check was added to the tailwater term of the groundwater flow
equation to insure that the term is zero when no tailwater depth
exists. See gwater.c.
8. Checks were added to the solution of the governing groundwater
mass balance equations to catch conditions where the lower zone
depth is greater than the total depth or when the upper zone
moisture content is greater than the porosity. See gwater.c.
9. A divide by zero error no longer occurs when computing the
hydraulic radius of an empty Filled Circular pipe whose filled
depth is zero. A similar error for the hydraulic radius of an
empty trapezoidal channel whose bottom width was zero was also
eliminated. See xsect.c.
10. The critical or normal depth adjustment made for a conduit is
no longer allowed to set the depth to zero -- some small depth
level is always maintained. See dynwave.c.
11. The Pump Summary Report was expanded to include number of start-
ups, minimum flow, and time off both the low and high ends of
the pump curve. See objects.h, link.c, stats.c, and statsrpt.c.
12. When the setting of an orifice or weir was changed to 0 (to
completely block flow) the flow depth in the element wasn't
being set to 0. This was only a reporting error and had no
effect on the flow routing calculations. See link.c.
13. The Node Surcharge Summary in the Status Report did not report
a ponded node as being surcharged. This was only a reporting
error and had no effect on the flow routing calculations. See
stats.c.
GUI Updates
1. A new map view variable for subcatchments, the percent of area
occupied by LID controls, was added. This view allows one to
easily distinguish which subcatchments have been assigned LIDs
and which haven't.
2. The LID Control Editor now checks to see that data fields that
require fractions (such as vegetative volume, void volumes,
soil porosity, etc.) contain valid entries.
3. The LID Group Editor now checks that the total area of all LIDs
assigned to a subcatchment does not exceed the area of the
subcatchment and that the total percentage of impervious area
treated by these LIDs does not exceed 100.
4. Comments applied to Time Patterns are no longer lost when a
project is saved and re-opened at a later time.
5. The File | Export | Hostart option now saves the current
groundwater state correctly.
1. A code refactoring error in build 5.0.019 that resulted in no
recovery of infiltration capacity during dry periods has been fixed.
See subcatch.c.
2. The pervious area adjustment used in 5.0.019 for evaporation and
infiltration to a subcatchment's groundwater zone was corrected.
See gwater.c.
3. The accounting of evaporation loss from just the pervious area of a
subcatchment has been corrected. See subcatch.c.
4. The rainfall + runon used to compute infiltration is no longer
pre-adjusted by subtracting any evaporation loss. See subcatch.c.
5. The rate for Green-Ampt infiltration is no longer allowed to be
less than the smaller of the saturated hydraulic conductivity and
the available surface moisture. See infil.c.
6. The available surface moisture for Green-Ampt infiltration is
considered 0 if its value is less than a small tolerance. See
infil.c.
7. Evaporation and infiltration losses from Storage nodes under
Kinematic Wave and Steady Flow routing are now accounted for
properly. See flowrout.c.
8. The Pollutant Loading summary tables in the Status Report now
lists results for all pollutants in a single table instead of
listing just 5 pollutants per table. See report.c.
GUI Updates
1. The anchoring of the components on either side of the splitter
bar on the Data Browser panel was changed to insure that the
main window is displayed correctly when SWMM is first launched.
2. The incorrect display of link slopes on the study area map under
the Elevation Offsets option was corrected.
1. The ability to explicitly model five different types of Low Impact
Development (LID) practices at the subcatchment level has been
added. Consult the LID Controls topic in the Help file for details.
See lid.c, lid.h, infil.c, infil.h, input.c, inputrpt.c, project.c,
statsrpt.c, and subcatch.c.
2. Pollutant buildup over a given landuse can now be specified by a time
series instead of just a buildup function. Consult the Land Uses /
Buildup topic in the Help index for more details. See landuse.c and
keywords.c.
3. An option was added to allow evaporation of standing water to occur
only during periods with no precipitation (the default is the current
practice of allowing evaporation in both wet and dry periods). See
climate.c, enums.h, keywords.c, objects.h, project.c, subcatch.c,
and text.h.
4. Storage node losses from evaporation and infiltration are now computed
directly within the flow routing routines to produce better
conservation of mass. See objects.h, routing.c, dynwave.c and node.c.
5. The check to see if flow in a link should not exceed the normal flow
now uses just the upstream Froude number rather than both up and
downstream numbers. See dynwave.c.
6. The maximum trials used when evaluating the flow and head equations at
a given time period for dynamic wave routing was increased from 4 to 8.
See dynwave.c.
7. The Ponding calculation for dynamic wave flow routing was changed once
again to obtain better continuity results. The depth in a surcharged
node that can pond is not allowed to rise higher than just beyond full
depth in any single time step. After that, its change in depth is
determined by the node's ponded area. Similarly, the depth of a ponded
node is not allowed to drop more than just below full depth in any
single time step. See dynwave.c and node.c.
8. For Kinematic Wave and Steady Flow routing, a node's ponded area is
no longer used to infer a ponded depth when a node floods with Ponding
turned on. Instead, the water depth is simply set to the node's maximum
depth and the ponded area parameter is simply used as a indicator as
to whether the node can pond or not. (This differs from dynamic wave
routing where the ponded area directly influences ponded depth through
the solution of the momentum and flow conservation equations.) See
flowrout.c.
9. As a consequence of the preceeding update, the Node Flooding Summary
table in the Status Report no longer displays the maximum ponded volume
in acre-inches (or hectare-mm). Instead it displays the maximum ponded
depth (ft or m) for Dynamic Wave flow routing or the maximum ponded
volume (1000 ft3 or 1000 m3) for other forms of routing. See stats.c
and statsrpt.c.
10. The groundwater mass balance equations were returned to the form they
had in release 5.0.013 since they were not correctly accounting for
the water volume transferred between the saturated and unsaturated
zones due only to a change in the water table depth. See gwater.c.
11. Controls based on flow rates now properly account for the direction of
flow when they are evaluated. This may require users to add an extra
condition clause to a rule that only applies for flow in the positive
direction (e.g., AND Link XXX FLOW >= 0.0). See controls.c.
12. The Villemonte correction for downstream submergence is now also used
for partly filled orifices (instead of just for weirs). See link.c and
dynwave.c.
13. A missing term in the equation used to check for submerged inlet
control for Culvert conduits was fixed. See culvert.c.
14. If a non-conduit link is connected to a storage node then its
contribution to the node's surface area is now ignored. See
dynwave.c.
15. The automatic adjustment of the maximum depth of a link's end nodes
to be at least as high as the link's crown no longer applies when
the link is a bottom orifice. See link.c.
16. A fatal error message is now generated if a conduit's entrance,
exit, or average loss coefficient value is negative. See link.c.
17. Requests to do internal routing of runoff between impervious and
pervious sub-areas of a subcatchment when only one type of sub-area
exists are now ignored. See subcatch.c.
18. The check on the error condition of a node having both incoming and
outgoing dummy conduits was modified so as not to get fooled by
Outlet-type links. See toposort.c.
19. The Ignore Snowmelt switch is now internally set to true whenever
there are no snow pack objects defined, so that precipitation is not
mistakenly converted to snow for a project with temperature data.
See gage.c and project.c.
20. When reading min/max daily temperatures from a climate file, the
values are now swapped if the minimum is greater than the maximum.
See climate.c.
21. When the Hargreaves method is used to compute an evaporation rate
from daily temperature values, negative rates are no longer allowed.
See climate.c.
22. Several bugs that prevented SWMM from detecting and reading Canadian
DLY02/04 climate files correctly were fixed. See climate.c.
23. An error message is now generated if a time series used for rainfall
is also used for another purpose in a project (since it will cause
the two uses to be out of synch). See error.h, error.c, gage.c,
climate.c, control.c, and inflow.c.
24. An error message is now generated if two Rain Gages with files as
their data source use the same Station IDs but different names for
the data file. See rain.c, error.h, and error.c.
25. When zero rainfall values appear in a rain file or time series they
are now skipped over and treated as a dry period, the same as would
occur had they not been entered in the first place. See gage.c.
26. A bug that caused the data in an evaporation time series to be out
of synch with the simulation time clock has been fixed. This only
affected evaporation data supplied from time series and not monthly
average data or data from climate files. See climate.c.
27. The water quality mass balance now correctly accounts for any initial
mass in the system created by using a hot start file. See massbal.c.
28. For models that only compute runoff and have a reporting time step
less than the wet time step, the latter is internally set equal to
the former. See swmm5.c.
GUI Updates
1. The Data Browser was updated to include the newly added Low Impact
Development (LID) objects and new dialog forms were added to specify
LID design data and their placement within a project's subcatchments.
2. You can now open a project input file by dragging it from Windows
Explorer (or the Desktop) and dropping it anywhere in SWMM's main
window.
3. A new checkbox was added to the Evaporation page of the Climatology
Editor to include the option to evaporate only in dry periods.
4. The choices for Function type on the Buildup page of the Land Use
Editor were extended to include an external time series (EXT).
5. SWMM will now continue to use the period (".") as the decimal
separator even if the user or the system changes the Windows Regional
Settings while the program is running.
6. A new installer program is now used that places the example data sets
in the user's My Documents\EPA SWMM Projects folder.
7. The components below the horizonal splitter bar on the Data Browser
panel were placed in their own panel component so that the splitter
would work correctly under Windows 7.
1. Reporting of the total infiltration + evaporation loss for each
Storage Unit (as a percent of total inflow to the unit) was added
to the Storage Volume Summary table in the Status Report. See
objects.h, node.c, stats.c, and statsrpt.c.
2. Double counting the final stored volume when finding the nodes with
the highest mass balance errors has been eliminated. See stats.c.
3. A warning message was added for when a Rain Gage's recording
interval is less than the smallest time interval appearing in its
associated rainfall time series. (An error message is issued if
the recording interval is greater than the smallest time series
interval.) See gage.c and text.h.
4. Hot Start interface files now contain the final state of each
subcatchment's groundwater zone in addition to the node and
link information they have always had. See routing.c.
5. To avoid confusion, the actual conduit slope is now listed in the
Link Summary table of the Status Report rather than the adjusted
slope that results from any conduit lengthening. See link.c and
dynwave.c.
6. The Status Report now displays only those summary tables for
which results have been obtained (e.g., if the Flow Routing
option is turned off, then no node or link tables are displayed).
See massbal.c and statsrpt.c.
7. Some code re-factoring was done to place rain gage validation
and initialization in separate functions. See project.c, gage.c,
and funcs.h.
8. The engine version number was updated to 50018 (this update had
been overlooked since release 5.0.010). See consts.h.
GUI Updates
1. A bug that prevented Status Report files from being deleted from
a users TEMP folder when they were no longer in use was corrected.
Users should check their TEMP folders (usually in
c:\Documents and Settings\\Local Settings\Temp)
for old files that begin with "swm". These can safely be deleted.
2. The project input file created for use by SWMM's Add-On Tools now
contains all project data, including map coordinates and element
tags.
1. The Ponding routine for dynamic wave flow routing was once
again modified, this time to account for the special case
where a node transitions between surcharged and ponded
conditions within a single time step. This should correct
the large continuity errors experienced with ponding under
release 5.0.016. See dynwave.c.
2. Error 112 (a conduit's elevation drop exceeds its length)
is now treated as a Warning condition and not a fatal error.
In this case the conduit's slope is computed as in earlier
versions of SWMM (elevation drop / length) instead of using
the more rigorous right-triangle method of HEC-RAS. See
link.c and text.h.
3. Inflow interface files no longer have to contain data for
all of the same pollutants defined in the current project
(e.g., they can contain just flows or some subset of the
pollutants). See iface.c.
4. Instead of using the rain gage's recording interval as the
time step for processing a set of RDII unit hydrographs, the
smaller of the wet runoff time step and the time to peak of
the shortest unit hydrograph in the set is now used. As a
result, it is now permissible to use hydrographs whose time
to peak is shorter than the rain gage recording interval.
See rdii.c.
5. Under Curve Number infiltration, infiltration now stops when
the maximum capacity (initially equal to 1000/CN - 10 inches)
is completely used up. See infil.c.
6. The small tolerance used to determine how much ponded depth
in excess of depression storage is needed to initiate runoff
was removed. This produces a smoother runoff response for
some data sets. See subcatch.c.
7. A default concentration for dry weather flow has been added
to the Pollutant object. It can be overriden for any specific
node by editing the node's Inflows property. See landuse.c,
routing.c, and objects.h.
8. For water quality routing, the simplified analytical
solution to the CSTR mixing equation was replaced with a
more robust finite difference approximation. This seems
to avoid numerical problems with high decay rates. See
qualrout.c.
9. First order decay was not being applied to pollutants
transported through conduits under Steady Flow routing. To
do this correctly required writing a special water quality
routine just for Steady Flow routing. See qualrout.c.
10. A small minimum depth tolerance was introduced for treatment
to occur at nodes and to have non-zero concentrations in
conduits. See qualrout.c.
11. Large water quality mass balance errors in systems that
provide treatment at nodes were eliminated by correctly
accounting for both the inflow mass and mass in storage
when computing the mass lost to treatment. See treatmnt.c.
GUI Updates
1. The property editor for Pollutant objects was modified to
accommodate the new default dry weather flow concentration
property.
2. The default dry weather runoff time step was reduced from
15 to 5 minutes and the default total duration was changed
from 0 to 6 hours.
3. The Ruler tool now displays a small square where the user
begins their measurement so that its easier to create a
closed polygon when measuring an area.
1. A new option was added to compute daily evaporation from the
daily temperature values contained in a climate file using
Hargreaves' method. (See climate.c, enums.h, keywords.h, and
text.h).
2. When the Ponding option is turned on, nodes that can pond are no
longer always treated like storage nodes that never surcharge.
Now they are only treated this way after ponding occurs. Otherwise
they behave like a normal node. (See dynwave.c).
3. The small tolerance used to decide when a storage node was full or
not has been removed since for very small time steps it could cause
a currently full storage unit to remain full even if there was some
small net outflow from it. (See node.c).
4. Spurious warnings for negative elevation offsets no longer appear
when the "*" entry is used for the offset value or when the offset
elevation value is within a small tolerance of the node invert
elevation. (See link.c).
5. When the water level at a storage node exceeds the highest level
supplied in its Storage Curve, an extrapolated surface area from
the curve is now used only if the curve is sloping outward (i.e.,
surface area is increasing with depth at the top of the curve). If
instead it slopes inward then the last surface area entry in the
curve is used. (See table .c).
6. Comma delimited NCDC rainfall files, both with and without station
name, can now be recognized and read correctly by SWMM. (See rain.c).
7. Space delimited NCDC rainfall files with empty spaces in the condition
code fields can now be read correctly. (See rain.c).
8. A bug created in release 5.0.015 that caused incorrect RDII inflows
to be computed when the rain gage recording interval was less than
the runoff wet time step has been fixed. (See rdii.c).
9. A new error check was added to detect if the time base of an RDII
unit hydrograph is less than its rain gage recording interval.
(See rdii.c).
GUI Updates
1. The Evaporation page of the Climate Editor was modified to accommodate
the new option for computing evaporation from daily temperatures.
2. Evaporation Rate has been added to the list of System variables that
can be viewed in time series plots and tables.
3. The term "Shape Curve" was replaced by "Storage Curve" in the Storage
Unit Property Editor to remove any confusion with the Shape Curve used
to define custom closed cross-section shapes.
1. Storage unit nodes have a new optional property named Infiltration
that can store Green-Ampt infiltration parameters for the unit and
thus allow it to serve as an infiltration basin. The Green-Ampt
infiltration model was modified to explicitly include the effect
of ponded water depth on infiltration rate. (See infil.c,
massbal.c, node.c, and objects.h).
2. Different sets of Initial Abstraction parameters (maximum depth,
initial depth, and recovery rate) can now be specified for each
of the three unit hydrographs (short term, medium term, and long
term) that comprise an RDII Unit Hydrograph group (see keywords.h,
keywords.c, objects.h, rdii.c, and text.h).
3. A Meander Modifier was added to a Transect's parameters. It is the
ratio of the length of a meandering main channel to the length of
the overbank area that surrounds it. This modifier is applied to
all conduits that use this particular transect for their cross
section. It assumes that the length supplied for these conduits is
that of the longer main channel. SWMM will use the shorter overbank
length in its calculations while internally increasing the main
channel roughness to account for its longer length. (See dynwave.c,
flowrout.c, link.c, objects.h, and transect.c).
4. NWS files in space delimited TD 3240 or 3260 format that include a
station name field have been added to the types of rainfall files
that are automatically recognized by SWMM (see rain.c).
5. The 2 GB binary output file size limit for runs made under the GUI
that was inadvertently added into release 5.0.014 was removed
(see output.c).
6. Any backflow that flows into an outfall node due to the head
condition at the node is now correctly reported as part of the
node's Total Inflow result (see node.c).
7. A fatal error is now generated if the smallest time interval between
values in a rainfall time series does not match the recording time
interval specified for the associated rain gage object (instead of
internally adjusting the gage interval and issuing a warning message)
(see error.c, error.h, and gage.c).
8. The normal flow limitation for dynamic wave flow routing based on
the Froude number now requires that the latter be greater or equal
to 1.0 for both the upstream and downstream flow depths rather just
for either of these (see dynwave.c).
9. A reporting error for the overflow rate into the ponded volume for
a node that floods under dynamic wave flow routing was corrected
(see dynwave.c).
10. The practice of not allowing a computed top surface width to be less
than the width at 4% of the full conduit depth for dynamic wave flow
routing has been dropped in favor of using the actual width, no matter
how small (see dynwave.c).
GUI Updates
1. Data entry forms were modified to support the new modeling features
described in the Engine Updates items (1) - (3).
2. A problem with the way that conduits with elevation offsets were
displayed in profile plots drawn prior to a run was corrected.
Rain Gages (gage.c, table.c, error.c, error.h, and objects.h)
1. The recording interval for a rain gage is now automatically adjusted
to be no greater than the smallest time interval for the gage's time
series data (with a warning message written to the Status Report).
2. When two or more rain gages reference the same time series data, a
fatal error message is now generated if the Rainfall Formats
(intensity, volume, or cumulative volume) for the gages are not all
the same.
Infiltration (infil.c)
3. The Green-Ampt infiltration rate was corrected for the case when
the surface becomes saturated part way through the current time step.
4. The saturated hydraulic conductivity is no longer needed by the
Curve Number method to compute a regeneration rate for infiltration
capacity. The latter is now set simply to the reciprocal of the user
supplied drying time. Thus the CN method now requires only two param-
eters (the CN and the drying time).
5. An optional monthly adjustment pattern can now be used to modify the
recovery rate of infiltration capacity by month of year. The name of
this pattern is specified as part of the Evaporation data. See the
Help file or the Users Manual for details. (This also affects files
climate.c, keywords.c, project.c, enums.h, objects.h, and text.h).
Flow Routing (flowrout.c, node.c, inflow.c, link.c, and objects.h)
6. A new Minimum Slope option has been added. When this option is non-
zero a computed conduit slope is not allowed to be below this value.
The default is 0. (Note: the slope of a conduit whose elevation
difference is below 0.001 ft is first computed using this elevation
difference and then is compared to the Minimum Slope value.) (The
following files were also changed for this feature: keywords.c,
project.c, enums.h, globals.h, text.h).
7. An optional Baseline Time Pattern was added for external inflows at
nodes. It can be used to apply a periodic adjustment to the baseline
inflow value by month of year, day of week, etc. See the Help file or
the Users Manual for more details.
8. Specific conduits can now be designated as Culverts and have Inlet
Control flow computed for them under Dynamic Wave flow routing.
9. The rating curve used to determine flow through an Outlet can now be
based on either the freeboard depth above the outlet bottom (as
before) or on the head difference between the upstream and downstream
nodes.
10. The calculation of the maximum outflow that a node can release over
a time step should be based on the initial volume, not the final
volume, at the node.
11. A problem with the program not accepting an ideal pump when the
connecting upstream conduit had an adverse slope was fixed.
12. The formula used to compute conduit slope was modified to match that
used by HEC-RAS.
13. A problem with the program crashing when the No Routing option was
selected in combination with the Save Outflows Interface File option
was fixed (see output.c).
14. Under Steady Flow and Kinematic Wave routing one can now use a Dummy
conduit that connects to a node at higher elevation without having
to specify an inlet offset.
Dynamic Wave Flow Routing (dynwave.c, link.c, and node.c)
15. Under-relaxation of flows for pumps between iterations of the
governing equations is no longer used since it can produce a
solution that does not conform to the pump's operating curve.
16. Instead of the average area, the upstream weighted area that
accounts for near-supercritical flow is now used in the dQ/dH
term for conduits.
17. The upstream/downstream Froude numbers used to check for normal
flow are now computed using hydraulic depth rather than flow depth.
18. When ponding is allowed, ponded volume is now computed from the
computed nodal depth rather than adjusting the depth to accommodate
the ponded volume based on the excess of inflow versus outflow. This
is a return to the original method that was used up until Release
5.0.010 and makes ponding (which is actually a form of storage)
consistent with the way that storage nodes are normally treated.
19. The volume at the inlet node of Type I pumps (where an implicit
wet well is assumed to occur) is now determined on the basis of
computed depth, just as with storage nodes, rather than computing
depth from the change in volume.
20. The possible closing of tide gates on outfalls directly connected
to orifice, weir, or outlet links is now correctly accounted for.
Conduit Cross-Sections (xsect.c)
21. The modified baskethandle (MODBASKETHANDLE) cross-section shape
was extended to allow the circular top to have any desired radius
equal or greater than half the section's width. It thus becomes
an upside down version of the Rectangular-Round shape. The section
geometry functions for both shapes received extensive revision.
Control Rules (controls.c)
22. "SIMULATION MONTH" and "SIMULATION DAY" (meaning month of the year
and day of the week, respectively) have been added to the types of
time conditions that can be used in a control rule condition clause.
Pollutant Buildup/Washoff (subcatch.c, landuse.c, and consts.h)
23. Washoff of a user-specified initial buildup when there is no buildup
function specified now works correctly.
24. The way that concentrations in runoff are combined with those
from runon and direct rainfall was modified so as to produce more
consistent results, especially when a BMP removal value is appled.
Water Quality Routing (qualrout.c, routing.c, treatmnt.c)
25. For storage units, the finite difference form of the mass balance
equation was replaced with the analytical CSTR solution.
26. An inflow rate adjustment was added when routing quality through
conduits under Dynamic Wave flow routing to help lower the mass
continuity error.
27. The formula for updating the hydraulic residence time (HRT) in a
storage node was revised.
28. Quality routing under Steady Flow routing is now treated as a
special case where the concentration within a conduit simply equals
that of the upstream node.
29. Any reverse flow into the system that occurs at an Outfall node is
now treated as an external inflow with respect to water quality and
will therefore contain whatever pollutant concentration was specified
for external inflows at the node even if no external flow inflow was
defined. This feature can be used to model saltwater or contaminant
intrusion in tidally influenced channels.
Groundwater (gwater.c):
30. The mass balance equations were re-formulated in a simpler fashion.
31. The flow equation was re-expressed in terms of distances above the
aquifer bottom instead of absolute elevations.
32. The equation for computing the maximum infiltration rate that the
upper zone can accept was corrected.
Snowmelt (snow.c)
33. Snow removal for a subcatchment now works by removing snow once the
"Depth at which removal begins" is reached. The fraction of this
amount that remains on the surface is whatever is left over after
all of the redistribution options are satisfied.
34. The "Depth at which removal begins" value is now correctly converted
to internal units of feet.
RDII (rdii.c)
35. A problem with no RDII being produced when two or more RDII unit
hydrographs utilized the same rain gage was fixed.
Time Series (table.c, error.c, error.h, objects.h)
36. Time Series data can now be imported from an external file instead
of having to be listed in the project's input file. See the Users
Manual or the Help file for details.
Simulation Options
37. A user can now choose to ignore any combination of the following
process models when running a simulation: Rainfall/Runoff, Snowmelt,
Groundwater, Flow Routing and Water Quality (swmm5.c, project.c,
runoff.c, subcatch.c, routing.c, keywords.c, keywords.h, text.h,
and globals.h).
Status Report (statsrpt.c)
38. The heading for the maximum flow column in the Link Flow Summary table
was changed to "|Flow|" to show that the flows listed are absolute
values.
39. The labels "Mgal" and "Mltrs" were replaced with "10^6 gal" and
"10^6 ltr", respectively.
40. The widths for the various types of flow volume fields (e.g., runoff
volume, node inflow volume, etc.) were increased in size.
Binary Output File (output.c)
41. The Report Start Time written to the binary results is now
adjusted to be be one reporting period prior to when the first
result is reported so that the GUI uses the correct date when it
displays results.
Output Report (command line version) (report.c)
42. Time series tables for reported subcatchments now report Snow Depth,
Groundwater Elevation, and Groundwater Flow (provided that snowmelt
and groundwater processes are included in the simulation).
GUI Updates:
1. Support was added for the following new engine features:
a. minimum conduit slope option
b. culvert designation for specific conduits
c. monthly infiltration recovery Pattern
d. Baseline Time Pattern for external inflows
e. updated Modified Baskethandle cross-section shape
f. either depth-based or head-based Outlet rating curves
g. options to ignore selected process models
h. use of an external file as source of time series data.
2. Regarding 1h above, the Time Series Editor dialog was modified to
include the external data file option.
3. A new category of Simulation Options named Reporting has been
added. When this category is selected for editing in the Data
Browser, a Reporting Options dialog appears from which one can
limit the number of objects whose simulation results are saved
and can be reported. The default is to save results for all
objects.
4. The Group Editing feature was extended to include subcatchment
Snow Packs and Groundwater Flow parameters.
5. The Help -> Tutorial menu command now works correctly to launch the
newer HTML version of the SWMM5 Tutorial Help file.
6. The File -> Export -> Hotstart File command now converts metric
results to internal SWMM US units before saving them to the hotstart
file.
7. Commas are no longer recognized as item separators when reading input
files since this was causing problems when a comma was used in the ID
name of an object (which is allowable).
8. The coordinates of the default natural areal depletion curve for snow
packs were changed to correspond to those appearing in the National
Weather Service publications on which SWMM's snow melt routines were
based.
9. A problem with not loading a specified startup input file when
epaswmm5.exe is launched from the command line (or from an Explorer
shortcut) was fixed.
10. A problem with the simulation progress meter not displaying the correct
number of elapsed days during long-term simulations was fixed.
11. A problem with Profile Plots not being updated correctly when users
changed certain display options was corrected.
12. The following updates to the Profile Plot feature were made:
i. The selected links are now checked to make sure that they exist
and form a connected path.
ii. The vertical axis scaling can now be set from the Profile Plot
Options dialog.
iii. The filled-in water level at junctions is now drawn only as high
as the maximum junction depth (i.e., the ground surface), even if
the HGL is higher.
13. A problem with copying just a single column of a Tabular Report to the
clipboard or to a file was corrected.
14. A problem with the selection buttons on the Time Series and Tablular
Report Selection dialog becoming stuck in the disabled mode was fixed.
15. If an external file (such as a rainfall climate, or interface file)
resides in the same directory as the project file then the directory
path portion of the file name is omitted when the file name is saved
within the project file. This will make it easier to share project
files with other users and computers.
16. The name of the "Rainfall" theme variable was changed to "Precipitation".
17. When the Auto-Backup program preference is selected, a backup file is now
created whenever the current project file is saved to disk, not just when
the project is first opened.
1. The check on acceptable values for site latitude was
corrected (see climate.c).
2. The definition and implementation of the PID controller
was changed. See the Help file or the Users Manual for
details (see controls.c).
3. The following changes were made to the dynamic wave flow
routing routine in dynwave.c:
a. A new method that places more weight on upstream conduit
geometry as the Froude number approaches 1 was added.
b. A code re-factoring error that crept into the inertial
term of the momentum equation was corrected.
c. The flow in a fully flowing open channel can no longer be
greater than the full normal flow.
d. The Normal Flow Limit based on both slope and Froude number
was modified to simply implement the two criteria together
in the same fashion as they are done individually.
e. A check was added that prevents any flow out of a node that
is dry.
f. The ponding computation was reverted back to that of 5.0.009
(depth is computed from volume rather than volume computed
from depth) to better maintain flow continuity.
g. Using the maximum allowable change in depth at a node as a
criterion for selecting a variable time step was restored.
4. The crown elevations of any connecting non-conduit links are
now considered when determining a node's crown elevation (see
flowrout.c).
5. The possibility that the initial setting of an orifice was not
being made correctly was eliminated (see link.c).
6. Error checks were added to test for invalid numbers in a hot
start file (see routing.c).
GUI Updates:
1. Checks were added to test for erroneous values in an INI file
that would prevent a graph from displaying properly.
1. The summary results tables written to the Status Report file
have been updated and expanded. See the Users Manual for more
details. Code changes to support this were made to dynwave.c,
flowrout.c, funcs.h, inputrpt.c (a new module), keywords.c,
keywords.h, link.c, objects.h, output.c, report.c, stats.c,
statsrpt.c (a new module), and text.h.
2. Conduit offsets can now be specified as an absolute
elevation or, as before, a relative depth above the node
invert. The same is true for the bottom of orifices, weirs,
and outlets. The "Link Offsets" setting in the GUI and the
corresponding LINK_OFFSETS entry in the project's input file
determine which option, DEPTH or ELEVATION, is in effect.
(see project.c, link.c, keywords.c, keywords.h, globals.h,
and text.h).
3. A PID-type controller has been added to the types of
modulated control rules that are available. See the Help
file or the Users Manual for instructions on how to use
this feature (see controls.c and keywords.c).
4. In the simulation results, "flooding" is now considered to
occur whenever the water level exceeds the top of a node,
whether ponding occurs or not. Before, flooding was only
recorded when there was no ponding and node overflow was lost
from the system (see dynwave.c, flowrout.c, massbal.c, node.c,
stats.c, and statsrpt.c).
5. The point at which the time to drain the upper soil zone for
Green-Ampt infiltration is first calculated was moved from time
0 to the time when the first rainfall period occurs. This fixes
a problem where different runoff hydrographs were being produced
when a project's start date was shifted slightly (see infil.c).
6. The criteria used to determine when steady state flow
conditions exist were changed to more closely follow those
used in SWMM 4 (see routing.c and the Help File or Users
Manual for the Skip Steady Periods option).
7. The optional user-assigned maximum flow limit for conduits was
made operational for all flow routing options, not just Dynamic
Wave routing (see link.c).
8. SI unit conversion problems for both a pump's on/off depth
settings and its pump curve slope values were fixed (see link.c).
9. The possibility that ponding could occur at the inlet (wet well)
node for a Type I pump was added (see dynwave.c).
10. A mistake in the Hazen-WIlliams head loss formula for force
main conduits was corrected (see forcmain.c).
11. The minimum limit of 0.0001 on flow area and hydraulic radius
computed from flow depth during dynamic wave routing was removed
since flow depth is already limited by this amount (see dynwave.c).
12. The flow direction test added for checking UPSTREAM CRITICAL and
DOWNSTREAM CRITICAL flow conditions in dynamic wave flow routing
was removed to prevent solutions from becoming stuck (see
dynwave.c).
13. The use of a maximum allowable change in depth at a node as a
criterion for selecting a variable time step for dynamic wave
flow routing was dropped (see dynwave.c).
14. A more refined method for computing the flow across a bottom
orifice at low heads was implemented. (see link.c).
15. The head loss calculation caused by flap gates in weirs was
extended to orifices as well (see link.c).
16. The computation of depth as a function of area for a trapezoidal
channel was extended to consider the case where the user used
0 for the side slopes (making it a rectangular channel - a
holdover from SWMM 4) (see xsect.c).
17. A bug introduced in 5.0.010 that was preventing RDII from being
computed for unit hydrographs that used the same rain gage as
another unit hydrograph was fixed (see rdii.c and objects.h).
18. Pollutant loading from RDII was corrected to be based on the
pollutant's specified RDII quality rather than its rainfall
quality (see routing.c).
19. The "Snow Only" option for the buildup of a pollutant was never
actually implemented and has now been added (see subcatch.c).
20. Additional error checking for valid snow melt and snow pack
input parameters was added (see snow.c, error.c, and error.h).
21. The same runoff threshold is now used for both pollutant washoff
(when above the threshold) and buildup (when below the threshold)
to avoid non-zero runoff concentrations from being reported
during periods with negligible runoff (see subcatch.c).
22. The values for total system outflow and system flooding that are
saved to the binary results file at each reporting time step are
now set equal to the same values that are used for computing the
overall flow continuity error, thus avoiding inconsistent system
outflow values being generated for some data sets (see output.c).
23. For the command line version of SWMM, the default END_TIME option
was corrected from being 24 days to 0 days (i.e., midnight of the
END_DATE value) (see project.c and swmm5.c).
GUI Updates:
1. The Status Bar on the bottom of the main window was given a new look,
with drop down buttons added for changing the Link Offsets convention
and the project's flow units.
2. A combo-box was added to the Nodes/Links page of the Project Defaults
dialog to select the Link Offsets convention (in addition to the
button on the Status Bar).
3. The choice of Flow Units was removed from the General Options page
of the Simulations Options dialog and placed into a drop down button
on the main window's Status Bar. (As before, one can also set flow
units from the Nodes/Links page of the Project Defaults dialog.
4. A Bookmarks panel was added to the Status Report window to make it
easier to navigate between different sections within the report.
5. A new Measurement Tool button was added to the Map Toolbar that
allows one to measure the distance of a polyline or the area of a
polygon drawn directly on the study area map.
6. Storage Units were added to the choice of objects that can be
edited using the Group Editor dialog.
7. The length assumed for non-conduit objects displayed on a profile
plot was reduced from 100 ft to 10 ft.
8. A "View Conduits Only" option was added to the Profile Plot Options
dialog that makes the plot display just the water depth in the
conduits along the profile and not show the HGL and ground surface.
This allows one to get a better view of how full a conduit is.
9. The Project Data viewer (launched when Project | Details is selected)
can now be split into two views by selecting Window | Split from its
menu bar (or Window | Remove Split to remove the split view).
10. The number of decimal places set for each computed variable on the
Number Formats page of the Program Preferences dialog is now saved
between sessions as the other preferences are.
11. Current simulation results are now always saved between sessions
(if requested by the user) even if data were modified after the
last run was made. In this case, when the project is opened again,
the Run Status icon will show that results are available but need
updating.
12. If the user changes the display format of a Date/Time axis in the
Graph Options dialog and checks the Default box in the dialog, then
this format will be used for all future time series plots for the
current project.
13. A problem with the Profile Plot dialog not always identifying the
path of fewest links between two nodes when asked to do so was
corrected.
14. Entries in the [REPORT] section of a project input file that were
used to define reporting options for the command line version of
SWMM 5 will no longer be lost when the project is run under the
GUI version of SWMM. The GUI version simply ignores them but adds
them into the project file whenever it is saved.
15. Conduit lengths and areas were always being re-computed after the
study area map's dimensions or distance units were changed with the
Map Dimensions dialog rather than only when the user selected the
re-compute option on the dialog.
16. The backdrop map now pans to the correct position when the Edit |
Find Object command is used to locate an object that is currently
not in view on the staudy area map.
17. The problem of having the name of a subcatchment's outlet node
or groundwater node be lost whenever that node was converted to
another type using the study area map's right-click popup menu
was fixed.
18. The Statistics Report analyzer was failing to include the last
event in its calculations for some data sets.
19. Additional input validation was added to the Snow Pack editor form.
1. A bug that prevented Weir and Outlet settings from being
updated after they were changed by control rules was fixed
(see link.c).
2. The control setting for a Weir was not being accounted
for when computing an equivalent orifice coefficient for
surcharged flow or when computing flow through a V-notch
weir (see link.c).
3. The reported depth of flow through a Weir was not taking into
account the Weir's control setting (see link.c).
4. An update made in 5.0.010 to how ponded depths and volumes are
computed under dynamic wave flow routing was corrected (see
dynwave.c).
5. The equations used to mix the quality of runon, rainfall and
ponded water over a subcatchment were revised to prevent
numerical instability at very low volumes (see subcatch.c).
6. Missing values in NCDC rainfall files that use the 'M' flag
are now added to the total number of missing records reported
(see rain.c).
GUI Updates
1. A bug introduced in release 5.0.010 that neglected to place
quotation marks around Map Labels and backdrop file names
(which can have spaces in them) when a project was saved to
file and which caused problems when the project was re-opened
has been fixed.
1. All "float" variables were re-declared as "doubles"
(except for those variables written to binary interface
files) and the engine was re-compiled using the Microsoft
VC++ 2005 compiler.
2. A new NO ROUTING option was added which allows a run to
ignore any flow routing and only compute runoff (see
swmm5.c, keywords.c, stats.c, and enums.h).
3. A new type of pump, an Ideal Pump, was added which pumps at a
rate equal to the inflow to its inlet node and does not use a
pump curve (see enums.h, link.c, and flowrout.c).
4. A new type of conduit shape, a Custom Shape, was added which
allows users to define their own cross-sectional geometry for
closed conduits. To implement this feature, a new type of curve,
a Shape Curve, was added which records how the width of the
cross-section varies with height. (See keywords.c, link.c,
project.c, report.c, shape.c, xsect.c, enums.h, funcs.h,
globals.h, objects.h, and text.h).
5. Another new type of conduit shape, a Circular Force Main, was
added. It is a circular pipe that uses either the Hazen-Williams
or Darcy-Weisbach equations, instead of the Manning equation,
for pressurized flow only. The Hazen-Williams C-factor or the
Darcy-Weisbach roughness height is one of the shape's parameters.
The choice of which equation to use (for Force Mains only) is a
new global option. (See project.c, forcmain.c, dynwave.c,
keywords.c, link.c, xsect.c, enums.h, globals.h and text.h).
6. Pumps can now have startup and shutoff inlet node depths supplied
directly as part of a pump's properties rather than as part of a
control rule. (See link.c, routing.c, objects.h, and funcs.h).
7. Orifices can now have timed gate openings and closings as in
SWMM 4 (i.e., the SWMM 4 ORATE parameter). (See link.c and
objects.h).
8. Unit Hydrographs used for RDII inflows can now have an initial
abstraction loss associated with them. Consult the Users Manual
or the Help file for details. (See rdii.c and objects.h).
9. A new criterion was added to determine when a conduit has
supercritical flow and therefore normal flow conditions
might apply. It is based on both water surface slope and
the Froude number (as opposed to just one or the other).
(See dynwave.c, project.c, keywords.c, enums.h, and text.h).
10. A Flow Instability Index is now computed for each non-pump link.
It counts the number of time steps in which the link's flow is
either higher or lower than the flows at the previous and next
time steps. The Status Report lists the links with the five
highest indexes. (See objects.h, stats.c, and report.c).
11. Node volumes are now initialized to take account of any initial
ponding that may be implied by the node depth stored in a hot
start file (see flowrout.c).
12. The area corrections to the inlet and outlet loss terms under
dynamic wave flow routing that were introduced in Build 5.0.008
were removed (see dynwave.c).
13. To comply more closely with standard hydraulic practice, the
head across an orifice is now computed with respect to the
midpoint of its opening, rather than to the bottom. Also,
orifices are now treated the same as weirs in terms of not
contributing any surface area to their end nodes (see link.c
and dynwave.c).
14. The partly opened setting for an orifice is now interpreted as
fraction of the full orifice opening height available rather
than as the fraction of the full area available. Also, the
equivalent discharge coefficient for a partly full orifice is
now re-computed whenever the setting of the orifice changes
(see link.c).
15. In kinematic wave flow routing, when a conduit's inflow is
limited to its maximum normal flow, its corresponding inflow
area is now correctly normalized to the full flow area (see
kinwave.c).
16. For dynamic wave flow routing, the criteria used to check if
a node is not full before using its depth to compute a variable
time step was corrected to avoid excessively small time steps
(see dynwave.c).
17. The width v. depth table for circular shapes was expanded to 51
entries to match that of the other tables for this shape (see
xsect.dat).
18. The number of entries in the geometry tables for irregular
cross-sections was increased to 51 entries (see objects.h).
19. For Divider nodes, both end nodes of the diversion link are now
checked to see if one of them is connected to the divider node
(see node.c).
20. Conditions on Outlet links are now correctly recognized in control
rule statements and an error message is now generated if more than
one rule clause is placed on the same line (see controls.c).
21. When the Ignore Rainfall option is used, a rain gage's rainfall is
now properly initialized to 0 to prevent a spurious rainfall value
from being reported (see gage.c).
22. An explicit check is now made in the engine (which already exists
in the GUI) to see if the ID name of the outlet of a subcatchment
exists as both a node and a subcatchment. If so, then Error 108
is thrown. (See subcatch.c).
23. The column in the Node Depth Summary of the Status Report that
previously displayed the total volume of ponded water at each
node (but was labelled "Total Flooding") now displays the maximum
volume of ponded water at each node and is labelled "Max Vol. Ponded".
Also, flow values appearing in the Status Report's tables were expanded
to 3 decimal places for MGD and CMS units, and an additional
decimal place was added to ponded area and conduit length in the
report's Input Summary tables (see stats.c and report.c).
24. When a node is ponded under dynamic wave routing, the water depth
is now always set equal to the ponded depth rather than the smaller
of the ponded and dynamic depths (see dynwave.c).
25. A more efficient way of processing the mathematical expressions
used in treatment functions has been implemented (see mathexpr.h,
mathexpr.c, and objects.h).
26. A bug in the Groundwater routine that allowed infiltration to
continue even when the entire groundwater table was saturated was
fixed as was a metric units conversion error on computed groundwater
flow (see gwater.c).
27. The locations of the left and right overbank stations for an
irregular channel transect are now adjusted by the Station Modifier
multiplier, in the same way as all of the other station locations
across the transect are.
28. An error in computing the flow contribution of the triangular
ends of a trapezoidal weir was corrected (see link.c).
29. A roundoff error under kinematic wave and steady flow routing that
sometimes caused nodes to be incorrectly reported as ponded was
fixed (see flowrout.c).
GUI Updates:
1. A "Tools" item was added to SWMM's main menu. The existing menu
options to set Program Preferences and Map Display Options were
moved there. In addition, it contains a "Configure Tools" option
that can be used register add-in tools with SWMM 5. Consult the
Users Manual or the Help file for more information regarding add-
in tools.
2. A "None" option was added to the choice of routing methods on the
General page of the Simulation Options dialog to accommodate the
new No Routing analysis option.
3. The Property Editor for Pumps was modified to allow the Pump Curve
field to remain blank (or accept a *) to signify the new Ideal type
pump and to accept startup and shutoff depths.
4. The Property Editor for orifices was modified to include a Time To
Close/Open field.
5. The Unit Hydrograph Editor dialog was modified to include the new
Initial Abstraction parameters.
6. The Analysis Options dialog was modified to accommodate the new
supercritical flow criterion.
7. The Cross-Section Editor and the Curve Editor were modified to
accommodate the new Custom cross-section shape feature as well as
the new Circular Force Main shape.
8. The File | Export menu has a new option that, once a run has been
successfully made, will export the node and link results at the
current time period being viewed to a Hotstart file.
9. The popup menu for toggling the map's Auto-Length feature was
replaced with a check box on the Status Panel.
10. A check box was added to the Map Dimensions dialog to ask if conduit
lengths and subcatchment areas should be recomputed when the Auto-
Length setting is on.
11. The Group Delete feature now offers the option of only deleting
objects with a specific value for their Tag property.
12. Ponded Area was added to the list of node parameters that can be
assigned a default value through the Project >> Defaults menu item.
13. The epaswmm5.ini file that contains a user's program preferences
is now saved to the users Application Data folder, in a sub-folder
named EPASWMM, rather than to the user's home folder.
14. Conduit slopes are no longer displayed as absolute values, so that
negative slopes will show up on a thematic display on the study area
map and will also be identified when a map query is made.
15. The bitmap image on the Run speed button was replaced.
16. The automatic identification of a connected path of links between
two nodes specified on the Profile Plot dialog now uses the path
with the smallest number of links.
17. The Study Area Map's Zoom Out feature no longer uses a zoom out
to previous extent. Instead it zooms out relative to the current
center of the map.
18. The Animator toolbar was made a permanent part of the Map Browser
panel.
19. The operation of the date and time controls on the Map Browser panel
were modified to work correctly with reporting times that are larger
than 1 day.
20. The options on the Map Query dialog were extended to allow one to
identify all nodes on the map that have been assigned a particular
type of external inflow (Direct, Dry Weather, RDII, or Groundwater).
-----------------------
Build 5.0.009 (9/19/06)
-----------------------
Engine Updates:
1. A climate file in the user-prepared format will no longer
be confused with one using the Canadian format (see
climate.c).
2. The minimum runoff which can generate pollutant washoff was
changed from 0.001 in/hr to 0.001 cfs (see subcatch.c).
3. A new RDII event now begins when the duration of a
continuous run of dry weather exceeds the base time of
the longest unit hydrograph rather than arbitrarily being
set at 12 hours (see rdii.c).
4. Problems with dynamic flow routing through long force mains
connected to Type 3 and Type 4 pumps have been corrected (see
dynwave.c and link.c).
GUI Updates:
1. A problem in displaying profile plots when all elevations
are below zero has been corrected.
----------------------
Build 5.0.008 (7/5/06)
----------------------
Engine Updates:
1. The conversion from the Horton infiltration drying
time input parameter to an equivalent regeneration
curve constant was corrected.
2. Pipe invert elevations at outfalls are now measured
relative to the outfall stage elevation rather than
the outfall's invert elevation.
3. Entrance/exit minor loss terms for dynamic wave flow
routing are now adjusted by the ratio of the mid-point
to entrance/exit areas to improve the energy balance.
4. A possible error in computing flow depth from head when
checking the normal flow limitation based on the Froude
number for dynamic wave flow routing was corrected.
5. A potential problem with converting the units of rainfall
read from an external file was corrected.
6. The equivalent length of orifices and weirs was changed
from being a minimum of 200 ft to a maximum of 200 ft.
7. Problems in displaying washoff mass balance results for
pollutants expressed as Counts/Liter were fixed.
8. The reporting of total system maximum runoff rate in the
Status Report's Subcatchment Runoff Summary table has been
corrected.
9. The subcatchment pollutant washoff process was
reprogrammed to provide more rigorous mass balance
results for the case where runoff from one subcatchment
is routed over another subcatchment or when there is
direct deposition from rainfall.
10. Checks for non-negative conduit offsets and orifice/
weir/outlet heights have been added.
11. A constant value and a scaling factor have been added to
Direct External inflows. See the Inflows Editor - Direct
Page topic in the Help file for more details.
12. A listing of total washoff loads for each pollutant for
each subcatchment has been added to the Status Report.
13. A new summary table of Node Inflows and Flooding has been
added to the Status Report.
14. A new summary table of Outfall flows and pollutant loads
has been added to the Status Report.
15. The 5.0.006 Engine Update #12 has been revoked.
GUI Updates:
1. The Inflows Editor was modified to accommodate the baseline
and scaling parameters added to direct external inflows.
2. The .INI file that saves a user's program preferences is now
saved to the user's home directory rather than the SWMM
installation directory.
3. The Select All command was extended to apply to the Status
Report display.
4. A new text file viewer component was used for the Status
Report to speed up the display of the report's contents.
5. A formating error on the Horizontal Axis page of the Graph
Options dialog form was corrected. This required making
changes to the custom Chart Dialog component that is included
with the GUI's source code.
6. Some cosmetic changes were made to the look of Tabular
reports.
7. Type 3 pump curves (head v. flow) are now displayed with
head on the vertical axis and flow on the horizontal axis
when the View option is selected in the Curve Editor dialog.
-----------------------
Build 5.0.007 (3/10/06)
-----------------------
Engine Updates:
1. An "Ignore Rainfall" analysis option was added that causes
the program to only consider user-supplied external inflow
time series and dry weather flows and ignore any rainfall
inputs that would otherwise produce runoff.
2. The hydraulic radius calculations for Rectangular-Closed,
Rectangular-Triangular, and Rectangular-Round conduit shapes
were modified to account for the increase in wetted perimeter
that occurs under full flow due to the top surface.
3. Refinements were made in several places in the code that need
to distinguish between Full Flow and Maximum Flow conditions in
closed conduits.
4. The code now properly accounts for the case where the depth at
which the maximum normal flow occurs through an irregular shaped
cross section is less than the full depth.
5. The final volume of any ponded water (caused by node flooding)
is now included in the reported flow continuity error.
6. Peak runoff flow was added to the Subcatchment Summary table
in the Status Report.
7. Non-conduit links are now included in the Link Flow Summary table
of the Status Report.
GUI Updates:
1. The Maximum Depth field in the Property Editor for a conduit with
an irregular shape now shows the correct value for any set of
transect elevation values.
2. The "Save Profile to File" button is now enabled when the user
manually adds a specified set of links to the Profile Plot dialog.
3. Link Flow Depth and Link Velocity have been added as choices for
calibration variables.
4. The way that non-conduit links are displayed on profile plots was
changed to avoid problems that occurred for weirs and orifices with
crest heights above the node invert.
5. A problem with the way that the Group Editing function was handling
the case of irregular shaped cross sections was fixed.
-------------------------
Build 5.0.006a (10/19/05)
-------------------------
Engine Updates:
1. The formula for snow melt rate during periods with rainfall
was corrected to return its value in ft/sec rather than in/hr.
2. A problem with generating routing interface files for systems
with just nodes and no links was corrected.
GUI Updates:
1. Numerical precision problems in computing centroids for
subcatchments with very small distances between vertices
were fixed.
2. A problem with no calibration data being shown on a time
series graph when some of the data were outside the range
of the graph was fixed.
3. A problem with calibration data represented as dates (not
elapsed time) being shifted one reporting period over in
time series graphs that used elapsed time was fixed.
----------------------
Build 5.0.006 (9/5/05)
----------------------
Engine Updates:
1. A new summary table of maximum volumes and outflow rates
for each storage unit has been added to the Status Report.
2. The SWMM 4 BC parameter, which specifies a minimum groundwater
table elevation for groundwater flow to occur, was added as an
optional groundwater flow parameter. If not provided then as
before, the invert of the receiving node defines the minimum
groundwater table elevation for flow to begin.
3. A new option was added to the Action clause of a control rule that
allows the control setting for pumps, orifices, weirs, and outlets
to be defined either by a curve (of setting versus node depth, for
example) or by a time series. See the "Modulated Controls" topic
in the Help file for more details.
4. The problem with interior nodes being mistaken for outfall nodes
(depending on the orientation of the connecting links) under water
quality analyses was fixed.
5. Geometry tables for standard size elliptical pipes were added
(the standard size code number in the input file was being mistaken
for an actual dimension).
6. Storage curves of area versus depth are now linearly extrapolated
when a depth exceeds the table limit (as in SWMM 4) rather than just
keeping the area constant.
7. Evaporation is no longer computed from a storage unit when it
becomes dry.
8. In water quality routing, concentrations in storage units are now
adjusted to reflect any evaporation loss over each time step.
9. It is now permissible to use the same hotstart file to both provide
initial values for a run and to save the final values from a run.
10. The code was modified to be able to read evaporation values from a
climate file during runs where no runoff computations are being
made (previously any evaporation in such files was being ignored in
data sets with no subcatchments).
11. A problem in the way that water quality was being routed through
dummy conduits was fixed.
12. For pollutant treatment functions that define fractional removal in
a storage unit node as a function of concentration, the concentration
used is now the inflow concentration into the node (as is done for
non-storage nodes), rather than the concentration in the storage unit.
13. The global first-order decay reaction assigned to specific pollutants
is not applied to any storage unit that has a treatment function
defined for the pollutant.
14. The total moisture available for infiltration at each time step of
the runoff process now has evaporation subtracted from it before
infiltration is computed.
15. Corrections were made to the way that the water volume in the upper
soil zone is depeleted during dry periods under Green- Ampt
infiltration.
16. A climate file is now positioned to begin reading at the start of the
simulation period (rather than the start of the file) unless the user
supplies a specific starting date to begin reading from the file.
17. A fatal error is now generated if the end of a climate file is reached
when seeking climate data during a run (rather than just maintaining
the same climate values for the remainder of the run).
18. The Node and Conduit flow statistics that appear in the Status Report
are now only collected over the reporting period of the simulation,
not the entire period (as would be the case when the user specifies
a Report Start Date that comes after the Simulation Start Date).
19. The computation of the initial and final groundwater storage volumes
used in the Groundwater Continuity table were corrected. This error
only affected the continuity numbers and not the computed flows and
water table levels.
GUI Updates:
1. The File >> Reopen command will now list up to 10 most recently used
files.
2. Map coordinates are now displayed with 3 decimal places in the Status
Bar.
3. The File >> Preferences dialog now contains a "Prompt to Save Results"
option. If left unchecked, simulation results will always be saved when
a project file is closed and will be available for viewing the next
time the project is opened.
4. A "Report Elapsed Time by Default" option was also added to the File >>
Preferences dialog. If checked, then time series graphs and tables will
default to using elapsed time, rather than date/time, as the time
variable. This choice can always be changed in the dialog box that
appears when a graph or table is first created.
5. Additional reporting variables were added to the list of parameters
for which Calibration Files can be used (e.g., groundwater elevation,
node flooding, etc.).
6. Percent impervious was added to the list of subcatchment themes that
can be viewed on the Study Area Map.
7. An Exceedance Frequency plot panel was added to the output produced
when a Statistics report is generated.
8. Users can now add, delete, or re-position items in the list of
links selected for a Profile Plot in the Profile Plot dialog using a
new set of buttons added to the dialog. Links are added to the list
by selecting the link either on the Map or from the Data Browser and
then clicking the PLUS button on the dialog.
9. Profile Plots can now be generated before any simulation results are
available. They include an Update button that allows one to update
the plot after editing changes have been made to any nodes or links
contained in the plot.
10. The Edit >> Find menu command (and its associated speed button) was
split into two sub-commands, one for finding objects on the map (as
before) and another for finding text within a Status Report.
11. Problems with the wrong data fields sometimes being updated in the
Group Editor were fixed.
12. The Interface File Combine utility was not working at all (the format
of the interface file had changed since the original code was written).
This has been fixed.
13. The centroids of subcatchment polygons on the map are now computed as
true centroids rather than being merely the average of the vertex
coordinates.
14. The Maximum Depth property is now preserved when a storage unit is
converted to a junction (by right-clicking on it and selecting
Convert To from the popup menu).
15. Map and Profile Plot animation is now turned off whenever the Animator
Toolbar is closed.
16. More universal support was provided for entering numerical values in
scientific notation throughout the GUI's various data entry fields.
17. Display problems with zoom-ins on the preview plots of Transects,
Curves, and Time Series in their respective Editor dialogs were fixed.
18. In the GUI source code:
a. The custom TOpenTextFileDialog component was renamed to
TOpenTxtFileDialog so as not to conflict with a Delphi 2005
component of the same name.
b. The custom ChartDlg component was modified to add support for a
chart axis that uses Date/Time labels.
c. A new unit named Ucalib.pas was added that includes the code for
reading data from Calibration Files that was previously contained
in the Fgraph.pas unit.
d. The Delphi DFM files for the project are now packaged as text
files, not binaries, in the source code distribution.
------------------------
Build 5.0.005b (6/15/05)
------------------------
Engine Updates:
1. The end node offsets for conduits with the partly filled
circular cross-section shape were not being increased to
account for the depth of fill.
2. Flow through a weir was not necessarily zero when the
water level on the side of the weir at higher head was
zero.
3. The "crest height" for a Bottom Orifice is now
interpreted as having the orifice lie in a horizontal
plane the specified distance above its upstream node's
invert. This allows riser outlet pipes in storage units
to be simulated.
GUI Updates:
1. The keyword "WEIR" was not being recognized as a
legitimate type of Flow Divider node by the GUI's
input data file parser.
2. The Profile Plot could display hydraulic grade lines
that dropped below the invert of a conduit.
------------------------
Build 5.0.005a (5/25/05)
------------------------
Engine Updates:
1. An erroneous error message that appears when a node has
multiple outflow links with one of them being an Outlet
link has been fixed.
GUI Updates:
1. Corrections were made for the way a Profile Plot is
drawn when negative elevation values occur.
------------------------
Build 5.0.005 (5/20/05)
------------------------
Engine Updates:
1. An error in computing ponded depths at flooded nodes under
Dynamic Wave flow routing was corrected.
2. The wrong lookup function was being used to find water
elevations at Time Series type outfall nodes.
3. An error in interpolating values stored on a routing interface
file was corrected.
4. The rainfall file reader was confusing the standard space-
delimted format with other file formats.
5. A reporting error for rainfall time series that had no ending
zero value was corrected.
6. A problem with neglecting to compute a snowmelt coefficient
for pervious areas was fixed.
7. The keyword for specifying that pollutant buildup be normalized
to curb length was modified to accept either CURB or CURBLENGTH.
8. The conversion factor the user supplies for external pollutant
mass inflows must now convert time series values into mass
concentration units per second (e.g., 5.25 will convert from lbs/
day to mg/sec). Flow units are no longer part of the conversion.
9. The ratio of maximum to design flow listed for each conduit in
the status report was corrected to account for the number of
barrels included in the conduit.
10. The minimum elevation change applied to a flat conduit was
changed to 0.001 feet, as used in SWMM 4.
11. The maximum depth of an irregular cross-section transect is now
based on the highest elevation of all stations, rather than just
the higher of the first and last station, and vertical walls
extending up to the higest elevation are added at the first and
last station if need be.
12. The nominal width property of an irregular cross-section transect
is now taken as the top width at full depth rather than the
maximum width over all depths.
13. At outfalls where the user-specified water elevation is below
that of a free outfall, the free outfall elevation is now used.
14. A new property, the maximum allowable flow, was added to the
Conduit object. The default value is 0.0, which indicates that
no maxmimum flow is prescribed.
15. Depths at outfall nodes under Steady and Kinematic Wave flow
routing are now reported as the depth in the connecting
conduit.
16. The calculation of the head over a non-surcharged, submerged weir
was corrected to be based on the height of water above the weir
crest, rather than the difference in heads on either side of the
weir.
17. The equation used to reduce the length of a weir with side
contractions was modified to fix a bug in SWMM 4.
18. A new water quality routing algorithm was written that produces
more robust results under Dynamic Wave flow routing.
19. The Compatibility Mode option under Dynamic Wave flow routing was
removed. Now there is just a single method used which has been
designed to be compatible with SWMM 4 yet produce more stable
results.
20. A new dynamic wave routing option was added that determines which
criterion decides when conduit flow is limited to normal flow (it
represents the KSUPER parameter used in SWMM 4).
21. A new flow routing option was added that allows routing calculations
to be skipped during periods of steady flow which can greatly reduce
the time required for continuous simulations.
GUI Updates:
1. An error in reading the flapgate parameter for Weirs in an input
file was corrected.
2. Having the Property Editor positioned outside the viewable screen
area when the user changed the video settings to a lower resolution
was corrected.
3. The Convert To option to change nodes from one type of object to
another was fixed.
4. The Routing Time Step option is now entered as fractional seconds
on the Analysis Options form. The older format of hrs:min:sec will
still be imported correctly from previous SWMM5 input files.
5. The ability to include a startup input file on the command line
that launches the GUI was added (add /f filename to the command
line where filename is the fully qualified name of the input file
to start with).
6. Support for output results files greater than 2 gigabytes was added.
7. The display of the hydraulic grade line in Profile Plots, and its
intersection with the flow volume in conduits was improved.
8. The summary results tables contained in the Status Report were
modified to display more useful information.
9. The graph options selection dialogs were made to behave more
consistently.
10. Support was added for copying and printing the graphical views of
curves, time series, and transects from within their respective
editors.
11. The SWMM 4 flow calibration data file (Extran1.dat) distributed with
the example data set Example2.inp was modified to contain the flows
actually produced by SWMM version 4.4h, rather than the original
numbers printed in the 1988 Extran manual.
In addition, the SWMM 5.0 Users Manual and Help file were updated to
reflect these changes and new additions.
------------------------
Build 5.0.004 (11/24/04)
------------------------
Engine Updates:
1. Fixes were made to the routines that identify and read data from the
NCDC-formatted external rain files.
2. The sign of reported velocity in links with adverse slope was
corrected.
3. Reading of results from previously saved Runoff Interface files
was corrected.
4. The calculation of a regeneration rate constant from a soil drying
time value for Curve Number infiltration was corrected, and the
method was modified to use a constant infiltration capacity during
each rain event, rather than a continuously declining capacity.
5. A correction was made to the dynamic wave routing routine for
SWMM4 and SWMM3 compatibility modes that improves the match with
Extran results from these earlier versions of SWMM.
6. The check for zero-sloped conduits was modified to include any
conduit with elevation difference below 0.01 feet.
7. The computation of the ponded depth at flooded nodes under dynamic
wave flow routing was corrected.
8. A check was added to make sure that the reporting time step is
not longer than the run duration.
9. Surcharged and high Froude number conduits were previously excluded
from consideration when computing a variable time step for dynamic
wave routing; they are now included.
10. The code numbers for the concentration units used for each pollutant
was added to the binary output file produced from a simulation.
GUI Updates:
1. Negative values can now be entered for temperature values that
appear on several input forms.
2. The input file reader now checks to make sure that the various time-
of-day option values are valid.
3. A problem with copying the correct dates for a Tabular Report that
is being copied to the clipboard or to a file was corrected.
4. The Graph Options dialog form was modified to display the Solid
option for Style whenever a Size greater than 1 is selected. (Due
to a limitation of the Graphics library used in EPA SWMM, only
solid lines can be drawn at a thickness greater than 1.)
------------------------
Build 5.0.003 (11/10/04)
------------------------
Engine Updates:
1. Modifications were made to full depth entries of width tables for
closed rounded cross-section shapes to improve the numerical
stability for dynamic wave flow routing.
2. Error 405 was added to detect if the size of the binary results
file would exceed the 2.1 Gbyte system limit.
3. A units problem for RDII inflows under metric flow units was
corrected.
4. A problem reading the TEMPDIR option when it contained spaces was
corrected.
5. Support for Canadian DLY02 and DLY04 temperature files was added.
6. Rule-based control of crest height for weirs was corrected
(previously the control setting adjusted flow rather than the
relative distance between weir crest and crown).
GUI Updates:
1. A problem with the Group Editing feature for conduits was corrected
(the editor would update the wrong conduit parameter).
2. Execution time for long term simulations on smaller projects was
speeded up considerably by only refreshing the progress meter every
day rather than every minute.
3. The time to draw time series graphs and perform statistical analyses
on large data sets was considerably shortened.
-----------------------
Build 5.0.002 (11/1/04)
-----------------------
Engine Updates
1. Modifications made to the Picard method used for dynamic wave
flow routing routine.
------------------------
Build 5.0.001 (10/29/04)
------------------------
First official release of SWMM 5.
Read more…
Innovyze Announces 2011 European Water and Flood Modelling Conference and Calls for Papers
Key Industry Event for European Modeling Professionals Slated for September 20-21, 2011.
More information at www.watermodelling.com
Broomfield, Colorado USA, May 10, 2011 — Innovyze, a leading global innovator of wet infrastructure modeling and simulation software and technologies, today announced the dates and issued a call for papers for the 2011 European Water and Flood Modelling Conference. The event, a comprehensive and significant wet infrastructure simulation and management technology gathering, will be held September 20-21, 2011 at the historic Tortworth Court hotel in South Gloucestershire.
This once-a-year learning opportunity for the European expert modeling community will feature powerful technical presentations showcasing projects from throughout the region, along with keynote addresses from industry leaders. Sponsorship packages are available.
The European conference attracts a distinguished gathering of water and wastewater experts and their managers who want to sharpen their skills, expand their knowledge, and share best practices with their peers. The ultimate goal of the event is to empower attendees to design, build, operate, manage and sustain better and more cost-effective systems; protect the environment; and safeguard public health.
Confirmed keynote speakers to date include Dr. Paul Boulos, Ph.D., Hon.D.WRE, F.ASCE, President and Chief Operating Officer of Innovyze, and Ms Helen James, who is Flood and Coastal Risk Management (FCRM) Senior Advisor for the UK Environment Agency.
The interactive forum will provide valuable industry insights and an opportunity to exchange cutting-edge information, proven strategies, cost-effective solutions and best practices with water and wastewater industry movers and shakers. It will also allow water and wastewater professionals to explore new ways of using engineering-GIS technology as well as advanced hydraulic modeling, asset management and information management applications. Participants will learn how they can leverage these tools to do their jobs better, easier, faster and more efficiently; maximize their return on software investments; and make their organizations more globally competitive.
The conference will also incorporate an annual gathering of Innovyze software users from the region, according to Innovyze EMEA Regional Manager Andrew Brown. “Attendees will learn about new products and new features, get tips and tricks for optimum software use, and hear from other users about practical applications of Innovyze products.”
The organizing committee is seeking relevant presentations to complement the presenters and speakers. Interested parties can visit http://www.watermodelling.com/ for submission details. Topics for consideration include:
Drainage and Flooding
Flood & Water Management Act
Surface water management plans (SWMPs)
The Water Framework Directive
Short- and long-term needs in the drainage and flooding sector
Challenges for urban drainage practitioners in AMP5
Public sector responsibility for implementing and delivering SWMPs
Flooding and unauthorized intermittent discharges (UIDs)
Catchment growth, changing weather patterns and emerging legislation
Integrated solutions including integrated catchment management and water cycle planning
Population growth planning and development
Water Supply
Reducing a network’s carbon footprint
Using transient analysis for optimum system design and protection
Developing, calibrating and validating water quality models
Efficiently operating and managing water distribution systems
Optimizing capital improvement programs
Using network modelling for regulatory compliance
Pressure and leakage management
“Today’s economic and environmental challenges demand innovative thinking, and much of it must focus on software applications that can optimize our world’s wet infrastructure systems,” said Boulos. “The Innovyze 2011 European Water and Flood Modelling Conference will showcase innovations and proven technologies in water and wastewater infrastructure engineering and management, and offers an exceptional forum for sharing best practices in solving everyday challenges and problems. Attendees can apply this valuable learning experience directly to their day-to-day projects, opening new and innovative avenues for improving and sustaining the world’s wet infrastructure and help people live healthy, satisfying lives.”
In 1882 came the most destructive flood of the nineteenth century. After breaking the levees in two hundred and eighty-four crevasses, the water spread out as much as seventy miles. In the fertile lands on the two sides of Old River, plantations were deeply submerged, and livestock survived in flatboats. A floating journalist who reported these scenes in the March 29th New Orleans Times-Democrat said, “The current running down the Atchafalaya was very swift, the Mississippi showing a predilection in that direction, which needs only to be seen to enforce the opinion of that river’s desperate endeavors to find a short way to the Gulf.”
John McPhee
Atchafalaya
The New Yorker, 2/23/87
The massive surge of water currently moving down the Mississippi River towards the Louisiana Delta may be remembered as the flood that affected New Orleans even more than Hurricane Katrina did. If this is the ‘five-hundred-year flood,’ the one that some say has been looming since 1973, the one that finally overwhelms the Old River Control Structure 300 miles upstream from the current outlet of the Mississippi to the Gulf of Mexico, then New Orleans will be devastated again. By lack of water.
The Mississippi River has been trying to go down the Atchafalaya River to the Gulf of Mexico for hundreds of years now, and we’ve been trying to stop it. Our defenses are going to be tested next week. I just hope the Army Corps of Engineers opens the Morganza Spillway first, prompting the evacuation of everyone in the Morganza Floodway. It’s going to take the cooperation of Louisiana Governor Bobby Jindal. Keep your fingers crossed.
Dr. Jeff Masters is the co-founder of Weather Underground, an invaluable weather site:
The levees on the Lower Mississippi River are meant to withstand a “Project Flood”-- the type of flood the Army Corps of Engineers believes is the maximum flood that could occur on the river, equivalent to a 1-in-500 year flood. The Project Flood was conceived in the wake of the greatest natural disaster in American history, the great 1927 Mississippi River flood. Since the great 1927 flood, there has never been a Project Flood on the Lower Mississippi, downstream from the confluence with the Ohio River (there was a 500-year flood on the Upper Mississippi in 1993, though.) On Sunday [May 1st], Major General Michael Walsh of the Army Corps of Engineers, President of the Mississippi Valley Commission, the organization entrusted to make flood control decisions on the Mississippi, stated: “The Project Flood is upon us. This is the flood that engineers envisioned following the 1927 flood. It is testing the system like never before.”
Alluvial rivers change their courses
John McPhee:
The Mississippi River, with its sand and silt, has created most of Louisiana, and it could not have done so by remaining in one channel. If it had, southern Louisiana would be a long narrow peninsula reaching into the Gulf of Mexico. Southern Louisiana exists in its present form because the Mississippi River has jumped here and there within an arc about two hundred miles wide, like a pianist playing with one hand-- frequently and radically changing course, surging over the left or the right bank to go off in utterly new directions.
Always it is the river’s purpose to get to the Gulf by the shortest and steepest gradient. As the mouth advances southward and the river lengthens, the gradient declines, the current slows, and sediment builds up the bed. Eventually, it builds up so much that the river spills to one side. Major shifts of that nature have tended to occur roughly once a millennium.
The Mississippi’s main channel of three thousand years ago is now the quiet water of Bayou Teche, which mimics the shape of the Mississippi. Along Bayou Teche, on the high ground of ancient natural levees, are Jeanerette, Breaux Bridge, Broussard, Olivier--arcuate strings of Cajun towns.
Eight hundred years before the birth of Christ, the channel was captured from the east. It shifted abruptly and flowed in that direction for about a thousand years.
In the second century a.d., it was captured again, and taken south, by the now unprepossessing Bayou Lafourche, which, by the year 1000, was losing its hegemony to the river’s present course, through the region that would be known as Plaquemines.
By the nineteen-fifties, the Mississippi River had advanced so far past New Orleans and out into the Gulf that it was about to shift again, and its offspring Atchafalaya was ready to receive it. By the route of the Atchafalaya, the distance across the delta plain was a hundred and forty-five miles-- well under half the length of the route of the master stream.
The story will have started upstream. Billions of tons of water, the spring melt from last winter’s snows, added to the rain that the land of over one-third of the continental United States can’t sop up, is spilling down the watercourses that funnel into the Mississippi River. Every spring the rivers rise, the levees hold the rivers back (usually), the tributaries join and then empty their water into Big River. One of them, the Ohio River, comes in at Cairo, Illinois, where the levee is 63 feet high. The water had been expected to crest at 61.5 feet on Tuesday, and stay that high for days. No one knows if the levee can withstand the pressure for that long; the old record high water was 60.5 feet.
You may have read that the Army Corps of Engineers was poised to dynamite the Birds Point Levee just downstream from Cairo, diverting 550,000 cubic feet of water per second onto 133,000 acres of Missouri farmland. That’s supposed to work like a Roto-Rooter visit, draining water away from Cairo, and was designed to lower the river there by 7 feet.
But it may not help people in Louisiana, because the floodway is designed to drain most of that water back into the Mississippi further downstream, at New Madrid. It’ll change the shape of the pulse of water headed south, will certainly add an unknown but tremendous amount of soil; but a lot more can happen before it gets to Red River Landing in Louisiana and tries to take a right turn, drop 20 feet, and slam down the Atchafalaya River. It takes 2 weeks for any one sip of fresh water to make it from Cairo, Illinois to New Orleans and out into the bayous and the Gulf of Mexico.
And rain, a lot of rain, is in the forecast for the next two weeks.
Is the System Working?
The Corps of Engineers dynamited the Birds Point Levee Monday night. Here's the frame by frame video of the breach explosions. At that time the Corps said they hoped to lower the water at Cairo by 4 feet, not the designed 7 feet. The National Weather Service graph at the Cairo river gauge says different:
The river receded not 7 feet or 4 feet but 2 feet. And the rains continue, so we’ll see. In western Tennessee, the tributaries keep rising at Memphis and upstream:
...[Q]uestions remain about whether breaking open the levee would provide the relief needed, and how much water the blast would divert from the Mississippi River as more rain was forecast to fall on the region Tuesday. The seemingly endless rain has overwhelmed rivers and strained levees, including the one protecting Cairo, at the confluence of the Ohio and Mississippi rivers.
Flooding concerns also were widespread Monday in western Tennessee, where tributaries were backed up due to heavy rains and the bulging Mississippi River. Streets in suburban Memphis were blocked, and some 175 people filled a church gymnasium to brace for potential record flooding. The break at Birds Point was expected to do little to ease the flood dangers there, Tennessee officials said.
The System that ‘Controls’ the Mississippi
The floods of 1927 might be said to be the cause of the disaster that may happen in 2011, because it was that natural event that resulted in the decision of the Army Corps of Engineers to tame the Mississippi River once and for all. Up to that year, the Corps had been focused on building levees, cutting off loops in the river, dredging channels. Reducing sedimentation had been thought key to maintaining the river’s depth, improving navigation, and making high-water pulses flow downstream as quickly as possible.
McPhee:
The ’27 high water tore the valley apart. On both sides of the river, levees crevassed from Cairo to the Gulf, and in the same thousand miles the flood destroyed every bridge. It killed hundreds of people, thousands of animals. Overbank, it covered twenty-six thousand square miles. It stayed on the land as much as three months. New Orleans was saved by blowing up a levee downstream. Yet the total volume of the 1927 high water was nowhere near a record. It was not a hundred-year flood. It was a form of explosion, achieved by the confining levees.
The plan changed. Here’s how the Corps now summarizes its mission on the Mississippi:
The Mississippi River & Tributaries (MR&T) project was authorized by the 1928 Flood Control Act. ... Administered by the Mississippi River Commission under the supervision of the Office of the Chief of Engineers, the resultant MR&T project employs a variety of engineering techniques, including an extensive levee system to prevent disastrous overflows on developed alluvial lands; floodways to safely divert excess flows past critical reaches to ease stress on the levee system [my emphasis]; channel improvements and stabilization features to protect the integrity of flood control measures and to ensure proper alignment and depth of the navigation channel; and tributary basin improvements, to include levees, headwater reservoirs, and pumping stations, that maximize the benefits realized on the main stem by expanding flood protection coverage and improving drainage into adjacent areas within the alluvial valley.
The Corps is responsible for the design, construction, and operation of a 485-mile-long Rube Goldberg contraption which both prevents and causes disastrous flooding. The Birds Point–New Madrid Floodway and four other downstream floodways are parts of the mechanism. Others include the levees that overtopped when the Gulf of Mexico surged up into New Orleans during Hurrican Katrina. The most ambitious (and perhaps hubristic) part of the system is at the Old River Control Structure. That’s a spillway built where the Red River used to used to flow out of Texas via Arkansas and pour its contents into the top of a looping bend the Mississippi made to the west. That was before the Atchafalaya, which flowed out of the bottom of the loop, snatched it in the 1940s.
Here’s the Plumbing
Controlling the river is a grand concept. Mississippi floods are disasters that, if they don’t carry off the people themselves, carry off all their worldly possessions, destroy their farms and the businesses they work for. The Corps realized after 1927 that sometimes the river was just too high for levees to contain, and the floodways were built, relief valves that could spread the water out. (They didn’t buy up the land in the Birds Point-New Madrid floodway, they used eminent domain to create “flowage rights”, and with a one-time payment bought the right to flow water over it when necessary. This week that happened for only the second time.) The downstream end of the floodway system is the Bonnet Carré Spillway in St. Charles Parish, whose 350 bays can (and pretty soon will) be opened to divert 250,000 cubic feet per second into Lake Ponchartrain, keeping the Mississippi River 3 feet below the top of 20-foot-high New Orleans levees.
The Bonnet Carré Spillway
The challenge evolves, because the river keeps changing
It had become more obvious that each year, accelerating in the 1940s, increasing flow was going down the Atchafalaya. In 1850 10% of the Red and Mississippi flow emptied down the Atchafalaya. In 1900 it was 13%, 18% in 1920, 23% in 1940, and 30% by 1950. In 1951 came the study with a firm prediction that at some point in the decade after 1965, once 40% was going down the Atchafalaya, the process would be irreversible, and the Mississippi would shrivel.
So the masters of creation from Pacific to Atlantic (the U.S. Congress) in 1954 decreed that “the distribution of flow and sediment in the Mississippi and Atchafalaya Rivers is now in desirable proportions and should be so maintained.” That is, that 70% of the water should continue down the Mississipi to New Orleans, and 30% should run down to Morgan City in the Atchafalaya. In major flood years, that dictates that the Old River defenses of the Army Corps of Engineers should master 2 million cubic feet of water, or 65,000 tons, every second. 5,616,000,000 tons a day. The Old River Control Structure, completed in 1963, was designed to be that defense.
If you read further down, you’ll see that a flood in 1973 proved the Corps’ design to be fallible. They subsequently added the Auxiliary Control Structure, another spillway, so now the system will definitely, definitely work as advertised. But short of testing the system by flooding everyone on the route down to Morgan City and drying up the Mississippi down the other way, how do you answer this question: can you really control the river?
Add a total unknown: what’s to stop the Mississippi from breaking through the levees close upstream, heading west from there, flanking the Maginot Line?
McPhee:
I once asked Fred Smith, a geologist who works for the Corps at New Orleans District Headquarters, if he thought Old River Control would eventually be overwhelmed. He said, “Capture doesn’t have to happen at the control structures. It could happen somewhere else. The river is close to it a little to the north. That whole area is suspect. The Mississippi wants to go west. 1973 was a forty-year flood. The big one lies out there somewhere—when the structures can’t release all the floodwaters and the levee is going to have to give way. That is when the river’s going to jump its banks and try to break through.”
Water goes where it wants to go. Both the Red River and the Mississippi River used to run south at this spot, pretty much parallel to each other. As always happens in the Mississippi, the riverbed silted up and water was diverted further and further to the west, resulting in what became known as Turnbull’s Loop:
By 1500 the loop had changed, and then by 1831 had invaded the Red River.
By then the Army Engineers had hired a civilian named Henry Shreve (Shreveport, yes) as ‘Superintendent of Western River Improvements’. Anyone who has read Samuel Clemens’ descriptions of Mississippi River life remembers the danger posed by ‘snags’, dead trees that lie just under the surface, waiting to rip a steamboat hull. Shreve fitted out a steamboat to drag snags out of the rivers. He irreversibly changed the Mississippi, first by clearing a 160-mile-long dead tree jam on the Red River that had blocked flow down the Atchafalaya.
Shreve creates the Old River by cutting the loop
McPhee:
In the sinusoidal path of the river, any meander tended to grow until its loop was so large it would cut itself off. At 31 degrees north latitude was a westbending loop that was eighteen miles around and had so nearly doubled back upon itself that Shreve decided to help it out. He adapted one of his snag boats as a dredge, and after two weeks of digging across the narrow neck he had a good swift current flowing. The Mississippi quickly took over. The width of Shreve’s new channel doubled in two days. A few days more and it had become the main channel of the river.
The great loop at 31 degrees north happened to he where the Red-Atchafalaya conjoined the Mississippi, like a pair of parentheses back to back. Steamboats had had difficulty there in the colliding waters. Shreve’s purpose in cutting off the loop was to give the boats a smoother shorter way to go, and, as an incidental, to speed up the Mississippi, lowering, however slightly, its crests in flood. One effect of the cutoff was to increase the flow of water out of the Mississippi and into the Atchafalaya, advancing the date of ultimate capture. Where the flow departed from the Mississippi now, it followed an arm of the cutoff meander. This short body of water soon became known as Old River. In less than a fortnight, it had been removed as a segment of the main-stem Mississippi and restyled as a form of surgical drain.
The ‘Old River’ in 1839
The Old River Control Structure
In the above diagram, the ‘Upper Old River’ and ‘Old River’ are what’s left of Turnbull’s Loop. The ‘Navigation Lock’ at the bottom allows ships to go from one river to the other. Levees keep guard on the Mississippi, should it ever get the idea of charging west. The Old River Control Structure is here called the ‘Low-sill control structure’. All of these structures are built on dried out mud. The closest bedrock is 7,000 feet down.
The 1973 flood
The Tennessee and Missouri Rivers supplied the water. McPhee:
The Corps had built Old River Control to control just about as much as was passing through it. In mid-March, when the volume began to approach that amount, curiosity got the best of Raphael G. Kazmann, author of a book called “Modern Hydrology” and professor of civil engineering at Louisiana State University. Kazmann got into his car, crossed the Mississippi on the high bridge at Baton Rouge, and made his way north to Old River. He parked, got out, and began to walk the structure.
“That whole miserable structure was vibrating,” he recalled in 1986, adding that he had felt as if he were standing on a platform at a small rural train station when “a fully loaded freight goes through.” Kazmann opted not to wait for the caboose. “I thought, This thing weighs two hundred thousand tons. When two hundred thousand tons vibrates like this, this is no place for R. G. Kazmann. I got into my car, turned around, and got the hell out of there. I was just a professor-- and, thank God, not responsible.”
Kazmann says that the Tennessee River and the Missouri River were “the two main culprits” in the 1973 flood. In one high water and another, the big contributors vary around the watershed. An ultimate deluge might possibly involve them all.
The precipitation that produced the great flood of 1973 was only about twenty per cent above normal. Yet the crest at St. Louis was the highest ever recorded there. The flood proved that control of the Mississippi was as much a hope for the future as control of the Mississippi had ever been. The 1973 high water did not come close to being a Project Flood. It merely came close to wiping out the project.
The Structure is repaired-- Kind of
In the words of the Corps, “The partial foundation undermining which occurred in 1973 inflicted permanent damage to the foundation of the low sill control structure. Emergency foundation repair, in the form of rock riprap and cement grout, was performed to safeguard the structure from a potential total failure. The foundation under approximately fifty per cent of the structure was drastically and irrevocably changed.”
Robert Fairless, a New Orleans District engineer who has long been a part of the Old River story, once told me that “things were touch and go for some months in 1973” and the situation was precarious still. “At a head greater than twenty-two feet, there’s danger of losing the whole thing,” he said. “If loose barges were to be pulled into the front of the structure where they would block the flow, the head would build up, and there’d be nothing we could do about it.”
The Auxiliary Control Structure
(Another Spillway. Genius.)
The Corps took pressure off the damaged Structure by building an additional spillway downstream, and a hydroelectric dam immediately upstream:
The Corps pegs the “Project Flood” at Red River Landing at 3,000,000 cubic feet per second. If you prevent the Mississippi from flowing down the Atchafalaya, then New Orleans ends up underwater. The plan is that half of the 3,000,000 cfs could be diverted down the Atchafalaya, some of that when it reaches another relief valve, the Morganza Spillway just south of the Old River complex. The Corps will open this up when the flow reaches 1,500,000 cubic feet per second, estimated to be next Wednesday, May 12.
So will this flood reach the levels of 1973? Vicksburg is just 120 miles upstream, and this forecast from the National Weather Service calls for a crest on June 18th higher than the 1973 flood, the one that shook the Old River Control Structure, which is now almost 40 years older.
945 PM CDT FRI APR 29 2011
THE FLOOD WARNING CONTINUES FOR
THE MISSISSIPPI RIVER AT VICKSBURG
* UNTIL FURTHER NOTICE.
* AT 9:00 PM FRIDAY THE STAGE WAS 42.8 FEET.
* MAJOR FLOODING IS FORECAST.
* FLOOD STAGE IS 43.0 FEET.
* FORECAST...THE RIVER WILL RISE ABOVE FLOOD STAGE BY TONIGHT AND
WILL CONTINUE TO RISE TO NEAR 53.5 FEET BY WEDNESDAY MORNING may 18th.
this crest is higher than the flood of 2008 by 2.5 feet and
the flood of 1973 by 0.3 feet.
Defenses against the river’s assault have been strengthened since 1973, so things might be okay, so long as it stops raining. The predictions don’t include rain that hasn’t fallen yet. The latest projection for Vicksburg river levels:
Yes. Now the prediction calls for a level equalling 1973 not on May 18th, but by May 9th.
Why is this happening now?
It’s getting harder to deny that something is changing the weather. November 2010 was the warmest ever recorded. Camarillo, California heated up to 83º last Sunday, a record. Lancaster, 85 miles away, registered a record cold of 32º. The residents of Alabama and other states last week suffered the devastation of the 3rd largest tornado outbreak ever recorded. The outbreak of April 14–16 is now only the 4th largest.
From Jeff Masters’ blog post of April 27:
Sea surface temperatures (SSTs) in the Gulf of Mexico are currently close to 1°C above average. Only two Aprils since the 1800s (2002 and 1991) have had April SSTs more than 1°C above average, so current SSTs are among the highest on record. These warm ocean temperatures helped set record high air temperatures in many locations in Texas yesterday, including Galveston (84°F, a tie with 1898), Del Rio (104°F, old record 103° in 1984), San Angelo (97°F, old record 96° in 1994). Record highs were also set on Monday in Baton Rouge and Shreveport in Louisiana, and in Austin, Mineral Wells, and Cotulla la Salle in Texas. Since this week’s storm brought plenty of cloud cover that kept temperatures from setting record highs in many locations, a more telling statistic of how warm this air mass was is the huge number of record high minimum temperature records that were set over the past two days. For example, the minimum temperature reached only 79°F in Brownsville, TX Monday morning, beating the previous record high minimum of 77°F set in 2006. In Texas, Austin, Houston, Port Arthur, Cotulla la Salle, Victoria, College Station, Victoria, Corpus Christi, McAllen, and Brownsville all set record high minimums on Monday, as did New Orleans, Lafayette, Monroe, Shreveport, and Alexandria in Louisiana, as well as Jackson and Tupelo in Mississippi. Since record amounts of water vapor can evaporate into air heated to record warm levels, it is not a surprise that incredible rains and unprecedented floods are resulting from this month’s near-record warm SSTs in the Gulf of Mexico. [My emphasis.]
Super-cell thunderstorms and the tornados that accompany them develop when a cold front sweeps through areas where the air is hot and very humid. And right now humidity is billowing up through tornado alley from the Gulf of Mexico. The 1ºC Dr. Masters was talking about may not sound like much, but a cubic foot of water stores vastly more energy than the same volume of air does; the intensity of a hurricane can be predicted by the ‘heat content’ of the top layer of water (up to 500 feet deep) that it’s passing over.
The Loop Current is an ocean current that transports warm Caribbean water through the Yucatan Channel between Cuba and Mexico. During summer and fall, the Loop Current provides a deep (80–150 meter) layer of vary warm water that can provide a huge energy source for any lucky hurricanes that might cross over.
The Loop Current commonly bulges out in the northern Gulf of Mexico and sometimes will shed a clockwise rotating ring of warm water that separates from the main current. This ring of warm water slowly drifts west-southwestward towards Texas or Mexico at about 3-5 km per day. This occurred in 2005, when a Loop Current Eddy separated in July, just before Hurricane Katrina passed over and “bombed” into a Category 5 hurricane. The eddy remained in the Gulf and slowly drifted westward during September. Hurricane Rita passed over the same Loop Current Eddy three weeks after Katrina, and also explosively deepened to a Category 5 storm.
This animation of warm water currents in the western hemisphere explains a lot; why New Orleans is a dangerous place to live, why the Mississippi is the 5th largest river in the world (by volume of water), and why the southern portion of Louisiana even exists in the first place. Water boils up from the Gulf and fills the low pressure systems moving eastward across the United States, gets dumped (with the airborne dirt that raindrops form around) on the 1,245,000 square miles of the watershed that feeds (among many others) the Big Black, Red, White, Arkansas, Ohio, Illinois, Tennessee, Missouri, and Mississippi rivers, scours the surface of the earth in 31 states and rushes sediment back down to the Gulf at Mud Bay, near Burrwood Bayou. Before 1900, before we ‘controlled’ the Mississippi, 400 million metric tons of sediment was added to the State of Louisiana every year.
Here’s 30 days worth of rainwater on its way to Louisiana:
Innovyze Launches New Product and New Name at Asia Pacific Conference
IWLive Introduced to Rave Reviews at the Asia Pacific Water and Sewer Systems Modeling Conference
Broomfield, Colorado USA, May 3, 2011 — Innovyze, a leading global innovator of wet infrastructure modeling and simulation software and technologies, recently concluded its annual Asia Pacific Water and Sewer Systems Modeling Conference in the Gold Coast, Australia. The conference was the first public event for the company under its new name, Innovyze. It also introduced the firm’s newest product, IWLive, to the Asia Pacific water community.
“The Asia Pacific 2011 conference was great. Very well organized and executed. [The] team did a fantastic job. The atmosphere and culture were great and this made the conference very enjoyable, informative, and motivating,” commented Stuart Sargent, Services Development Engineer for Marlborough District Council in New Zealand.
The highlight of the conference agenda was the introduction of IWLive. Created for use in the water distribution control room, it gives operators unprecedented decision making ability. Using IWLive, they can run accurate hydraulic simulations that factor in energy costs, weather, real time (or delayed) SCADA telemetry, demand history, valve and pumping control scenarios. The benefits of this data go beyond increasing efficiency and reducing energy consumption. It also helps control room operators understand the effects of main breaks, pump and reservoir shutdowns, and other scheduled maintenance.
Traditional hydraulic modeling platforms like InfoWorks WS and InfoWater have long been used to predict the behavior of water supply and distribution networks and evaluate engineering options within the network. The evolution of computer technology has enabled utilities to more readily build and run “all-pipe” models that represent an entire distribution system in a single view. Inevitably, this capability began to be used for modeling not only planned activities, but responses to major systems incidents, such as a burst trunk main.
IWLivehas enhanced the accessibility of this approach by equipping the control room with tools that are both predictive and reactive. It issues regularly updated warnings to alert the control room operator to problems that may occur in the coming minutes, hours, or days. The operator can see the predicted severity of problems and the time of onset in one easy-to-use interface. Beyond automatic prediction, IWLive can also enable the control room operator to evaluate problem-solving approaches by simulating the closure of valves or a change in a pump’s operating schedule. It quickly produces a second simulation that can be compared with the first to determine the level of improvement, the problems that remain, and the costs of the change.
The conference also provided a forum where water, wastewater and stormwater professionals could explore new ways of applying engineering GIS technology, advanced network modeling and simulation, and asset management applications. Attendees learned how to leverage these tools to do their jobs better, easier, faster and more efficiently; maximize their return on software investments; and make their organizations more globally competitive.
The event’s keynote speaker, Innovyze President and Chief Operating Officer Paul F. Boulos, Ph.D, Hon.D.WRE, F.ASCE commented, “With IWLive, we have changed the paradigm for how and where hydraulic models can be applied. Our customer base includes many of the world’s largest and most sophisticated water distribution operations. IWLive will give them the ability to react quickly and efficiently to many common operational scenarios, allowing them to improve system performance, security and reliability, enhance customer service, reduce energy costs and carbon footprint, safeguard critical infrastructures and maximize their ability to protect public health. It was exciting to share these industry advances with the Asia Pacific community.”
Charles Fishman bemoans the fact that a foursome in Las Vegas playing 18 holes will use as much water as a typical US family uses in a month. But the city is turning itself around:
It's illegal now to have a front lawn in any new home in Las Vegas. The water authority will pay people who already have lawns to take them out--$40,000 an acre-- and replace them with native desert landscaping. They pay golf courses to do the same thing. ... [T]he Las Vegas metro area now collects, cleans, and recycles to Lake Mead 94 percent of all water that hits a drain anywhere in the city. Essentially, the only water that isn't directly recycled back to the source is the water used outdoors.
No city in the U.S. matches that.
Ben Jervey follows California's water problem, and some of its more novel solutions:
A couple years ago the Orange County Water District opened the world’s largest such wastewater recycling plant. In fact, if you’ve visited Disneyland recently and sipped from a water fountain, you’ve already drunk this “toilet-to-tap” water.