All Posts (522)

Sort by

WE CAN RUN THE ENTIRE WORLD ON WIND, WATER AND SOLAR POWER BY 2050

James Hrynyshyn in Class M:

Wind_powerSure wind power contributes only fraction of what coal does to the U.S. electrical grid, but it turns out it's already competitive with natural gas in some markets. Yes solar photovoltaics are expensive, but costs are falling fast (as opposed to nuclear power) and it's only a matter of five or 10 years at current rates before even PV arrays make economic sense for select consumers.

Finally, we're getting some honest assessments. First up is a pair of papers in the journalEnergy Policy by Stanford's Mark Z. Jacobson and UC Davis' Mark A. Delucchi collected under the common title of "Providing all global energy with wind, water, and solar power."Part 1 deals with the physical issues and Part 2 the economics. The conclusion of their exhaustive research is that is it entirely possible to run the entire world on wind, water (hydro-electricity) and solar power (both PV and concentrated thermal) by 2050. And they aren't restricting themselves to the electrical grid. This includes replacing all fossil fuels with batteries and fuel cells:

Such a WWS infrastructure reduces world power demand by 30% and requires only 0.41% and 0.59% more of the world's land for footprint and spacing, respectively. We suggest producing all new energy with WWS by 2030 and replacing the pre-existing energy by 2050. Barriers to the plan are primarily social and political, not technological or economic. The energy cost in a WWS world should be similar to that today.

How will we build it? Well, the numbers at first look daunting.

We estimate that ~3,800,000 5-MW wind turbines, ~49,000 300-MW concentrated solar plants, ~40,000 300-MW solar PV power plants, ~1.7 billion 3-kW rooftop PV systems, ~5350 100 MW geothermal power plants, ~270 new 1300-MW hydroelectric power plants, ~720,000 0.75-MW wave devices, and ~490,000 1-MW tidal turbines can power a 2030 WWS world that uses electricity and electrolytic hydrogen for all purposes.

But given how rapidly a modern industrial nation can build things like tanks and airplanes -- as the American experience during the Second World War proves -- the author's argument that we DO have the technology is pretty convincing.

More here.

Read more…

Heavy Rains Linked to Humans - NYT

Heavy Rains Linked to Humans

Carl De Souza/Agence France-Presse — Getty Images

Pakistan suffered from devastating floods in 2010, which left these Pakistanis trapped on a strip of land surrounded by water.

An increase in heavy precipitation that has afflicted many countries is at least partly a consequence of human influence on the atmosphere, climate scientists reported in a new study.

A blog about energy and the environment.

Toby Melville/Associated Press

Members of the British Army tried to reinforce floodwalls in North Yorkshire in November 2000, when severe rains flooded England and Wales.

In the first major paper of its kind, the researchers used elaborate computer programs that simulate the climate to analyze whether the rise in severe rainstorms, heavy snowfalls and similar events could be explained by natural variability in the atmosphere. They found that it could not, and that the increase made sense only when the computers factored in the effects of greenhouse gases released by human activities like the burning of fossil fuels.

As reflected in previous studies, the likelihood of extreme precipitation on any given day rose by about 7 percent over the last half of the 20th century, at least for the land areas of the Northern Hemisphere for which sufficient figures are available to do an analysis.

The principal finding of the new study is “that this 7 percent is well outside the bounds of natural variability,” said Francis W. Zwiers, a Canadian climate scientist who took part in the research. The paper is being published in Thursday’s edition of the journal Nature.

The paper covers climate trends from 1951 to 1999 and therefore does not include any analysis of last year’s extreme precipitation, including catastrophic floods in Pakistan, China and Australia as well as parts of the United States, including Tennessee, Arkansas and California. However, the paper is likely to bolster a growing sense among climate scientists that events like the 2010 floods will become more common.

Indeed, an increase of weather extremes has been a fundamental prediction of climate science for decades. Basic physics suggests that as the earth warms, precipitation extremes will become more intense, winter and summer, simply because warmer air can carry more water vapor. Weather statistics confirm that this has begun to happen.

Scientists have long been reluctant to attribute any specific weather event to global warming, but a handful of papers that do so are beginning to appear in the scientific literature. One such installment is being published on Thursday in Nature as a companion piece to the broader paper. It finds that severe rains that flooded England and Wales in 2000, the wettest autumn since record-keeping began there in 1766, were made substantially more likely by the greenhouse gases released by human activity.

In that analysis, scientists at the University of Oxford used computer time donated by the public to analyze the climate of Britain in 2000 as it actually existed and to compare that with a hypothetical climate in which the Industrial Revolution never happened and few greenhouse gases were released.

The computers found that the chances of those memorable floods, which sent geese swimming through city streets, were roughly doubled in a climate with the greenhouse gases.

That it took a decade to come to that conclusion illustrates one of the major problems of climate science at the moment. Researchers are barraged with questions about weather extremes like the recent winters in Europe and the United States and the heat waves and droughts of last summer.

Yet, even when adequate weather statistics are available for an affected region, the scientists need years to run computer analyses of any specific event and calculate whether it was made more or less likely by global warming.

In a briefing for reporters, a leading climate scientist for the British government, Peter A. Stott, acknowledged a need for more rapid analysis of weather extremes and said that researchers were working to develop this capability.

The problem is becoming more than theoretical. Billions of dollars have been pledged by rich countries to help poor countries adapt to climate change.

“Because that money is on the table, it’s suddenly going to be in everybody’s interest to be a victim of climate change,” said Myles R. Allen, a University of Oxford researcher whose group ran the British flood study. “We need urgently to develop the science base to be able to distinguish genuine impacts of climate change from unfortunate consequences of bad weather.”

The analyses being published on Thursday can be expected to draw fire from climate-change contrarians, who have long scoffed at computer simulations of the climate. They point out that such programs cannot fully capture the complexity of the real world.

Mainstream scientists acknowledge that point to a degree but contend that the programs are becoming more accurate. They also note that the programs are the only tools available to answer questions about how much humans are influencing the climate.

“In the future, it won’t be enough for your weather service to predict the weather,” Dr. Allen said. “They’ll have to explain it as well.”

Read more…

MWH Soft Ships Groundbreaking IWLive for Real Time Forecasting 
and Day-to-Day Operation of Water Distribution Systems


Highly Anticipated Release Equips Control Rooms with Unprecedented Decision-Making Capability


Broomfield, Colorado USA, February 15, 2010 — MWH Soft, a leading global innovator of wet infrastructure modeling and simulation software and technologies, today announced the worldwide release of IWLive for real time water distribution hydraulic modeling, forecasting and SCADA integration. The groundbreaking release givesInfoWorks WS users the ability to move their hydraulic modeling and simulation applications from planning and design to operation and control. The product builds on the success of MWH Soft’s Floodworks product line for real-time flood and collection system forecasting. This latest debut underscores MWH Soft’s vanguard position in the water industry and its continuing commitment to delivering pioneering technology for enhancing the safety, efficiency and reliability of the world’s water supply.

IWLive allows utilities to harness the power of hydraulic modeling in the control room,” said Andrew Brown, EMEA Regional Manager for MWH Soft. “With increasingly complex water distribution systems, IWLive provides an affordable solution tailored to the day-to-day needs of system operators, whilst at the same time meeting the primary needs of a utility to supply a clean and reliable supply of water in the most efficient and cost-effective manner.”

Intended for use in the water distribution control room, IWLive gives operators unprecedented decision making ability. They can run accurate hydraulic simulations that factor in energy costs, weather, real time (or delayed) SCADA telemetry, demand history, valve and pumping control scenarios. Beyond increasing efficiency and reducing energy consumption, IWLive can help control room operators understand the effects of main breaks, pump and reservoir shutdowns, and other scheduled maintenance.

InfoWorks WS has long been used to predict the behavior of water supply and distribution networks and evaluate engineering options within the network. The evolution of computer technology has enabled utilities to more readily build and run “all pipe” models that represent an entire distribution system in a single view. Inevitably, these models began to be used for modeling not only planned activities, but responses to major systems incidents, such as a burst trunk main.

IWLive has enhanced the accessibility of this approach by equipping the control room with tools that are both predictive and reactive. It issues regularly updated warnings to alert the control room operator to problems that may occur in the coming minutes, hours, or days. The operator can see the predicted severity of problems and the time of onset in one easy-to-use interface. Beyond automatic prediction, IWLive can also enable the control room operator to evaluate problem-solving approaches by simulating the closure of valves or a change in a pump’s operating schedule. It quickly produces a second simulation that can be compared with the first to determine the level of improvement, the problems that remain, and the costs of the change.

The IWLive interface is fully optimized for operator use. It allows operators to see a map of all water infrastructures for which they are responsible, including appropriate background maps. Highlighted color coding shows predicted problem areas; a single click produces a detailed map showing pipes, valves, pumps, reservoirs and other water assets. Animation of the map shows the development of the problem; graphs show simulated pressures and reservoir levels. IWLive can be accessed remotely over a VPN. It can also be configured to send critical warning messages via SMS or email.

“With IWLive, MWH Soft has changed the paradigm for how and where hydraulic models can be applied,” said Paul F. Boulos, Ph.D, Hon.D.WRE, F.ASCE, President and Chief Operating Officer of MWH Soft. “Our customer base includes many of the world’s largest and most sophisticated water distribution operations. IWLive will give them the ability to react quickly and efficiently to many common operational scenarios, allowing them to improve system performance and reliability, enhance customer service, save money, safeguard critical infrastructures and maximize their ability to protect public health.”

Read more…

MWH Soft Releases InfoSewer V7 with Significantly Enhanced
Modeling Functionalities and Reporting Capabilities


New release adds powerful analysis features for an improved modeling experience


Broomfield, Colorado USA, February 8, 2010 — MWH Soft, a leading global innovator of wet infrastructure modeling and simulation software and technologies, today announced the worldwide availability of the V7 Generation of InfoSewer for ArcGIS (Esri, Redlands, CA) platform. InfoSewer has helped define the standard in the industry for GIS-centric sanitary sewer network modeling and design since 2003. This seventh version of the software introduces key enhancements requested by customers that increase engineering productivity; improve network analysis and design; and enhance the visualization, comprehension, management and assessment of modeling results.

Certified by the National Association of GIS-centric Software, InfoSewer is a powerful ArcGIS-centric software for use in planning, designing, analyzing, and expanding sanitary, storm and combined sewer collection systems. It can be effectively used to model both dry-weather and wet-weather flows and determine the most cost-effective and reliable method of wastewater collection. Built atop ArcGIS, InfoSewer enables engineers and GIS professionals to work simultaneously on the same integrated platform, commanding powerful geospatial analysis and hydraulic modeling in a single environment using a single dataset.

InfoSewer is used worldwide by municipal engineers and planners to create detailed, accurate models of their sewer infrastructure systems. These models enable users to evaluate the effect of new developments, zoning changes, and other additional loads on system flows; pinpoint current and future problem areas; predict overflows and backups; and determine how to best restore needed capacity lost to infiltration and inflow with the least rehabilitation. In addition, users rely on these models to compute hydrogen sulfide generation and corrosion potential; analyze the rate of Biochemical Oxygen Demand (BOD) exertion; track sediment movement and deposition; trace pollutant contribution from source nodes, perform time of concentration pipe calculations; calculate the amount of pollutant transported to the wastewater treatment plant; and assess pollutants’ impacts on receiving waters. Extensive scenario management functionality enables the analysis of existing or future sewer collection systems. The application also provides vital tools for meeting and exceeding environmental regulations and improving community relations via database queries and map displays.

The new InfoSewer V7 delivers advanced design functionality and exponential increases in efficiency while simplifying use, and improves speed and reliability by using memory more efficiently when working with large models. In addition to refinements throughout, users can now quickly and reliably design new sewer collection systems that consider standard design criteria such as flow depth-to-pipe diameter ratios, velocity, slope, soil cover depth, and pipe crown drop. Using user-input manhole locations and rules, InfoSewer V7 calculates the optimal pipe and slope, invert elevation of conduits and manholes, soil cover depths at both ends of each pipe section, and cost of excavation and reinstatement to meet target design criteria. Results can be reviewed using profile plots with advanced labeling of 30 node and link variables, color coded sewer maps of these variables, or 20 comprehensive tabular reports. The profile plots can be automatically updated in the model database for steady state and extended period simulations of new and existing designs, greatly simplifying the model building process. Together, these important modeling capabilities will help wastewater utilities worldwide dramatically raise productivity and efficiency by rapidly developing practical and optimal capital improvement strategies that minimize costs while improving system reliability, integrity and performance. By making engineering professionals more productive and their organizations more competitive, InfoSewer V7 delivers benefits utilities can pass on to their customers through better designs and higher quality standards, achieved in a shorter turnaround time.

Read more…

Note:   How to Calculate the Freeboard of a Node in InfoSWMM/H2OMAP SWMM from the Model Results

The freeboard for a node in InfoSWMM/H2OMAP SWMM can be calculated with a 4 step process:

1.   Copy the Node Rim Elevations from the DB Tables for Junctions to Excel,
2.   Run the model and then copy the Maximum HGL from the Junction Summary output table to Excel,
3.   Calculate the Freeboard in Excel as the Rim Elevation minus the Maximum HGL in Excel,
4.   Create a new column called Freeboard in the Junction Information DB Table and paste the Freeboard from Excel.

You will be able to perform Map Displays or Map Queries now using the new Freeboard information column.
Figure 1.  4  Step Process to Calculate Freeboard
Read more…

Note:  Steps in converting a Arc GIS 10 Model to a Arc GIS 9.3 Model in InfoSWMM or InfoSewer


Step 1.  Make an empty Arc GIS 9.3 model in InfoSWMM using the Arc GIS Default when initializing the model,

Step 2.  Save the empty model and then copy and paste the files from the Arc GIS 10 ISDB folder to the Arc GIS 9.3 folder, but not the MAP sub directory,

Step 3.  Open the Arc GIS 9.3 mxd file and then use the Tool Update Map from DB after Initialization,

Step 4.  Zoom to the model extents and then set data frame to the model view so it can be used more efficiently in the future before saving the model.

Read more…

Global Top Ten Water Utility Standardizes on InfoWorks WS


Award-Winning Yorkshire Water Adopts InfoWorks WS for Water Distribution Modeling and Simulation

Broomfield, Colorado USA, January 25, 2011 — MWH Soft, a leading global innovator of wet infrastructure modeling and simulation software and technologies, today announced that, following a robust evaluation of the marketplace, Yorkshire Water Services Ltd (UK) has chosen MWH Soft’s InfoWorks WS software as its standard water distribution modeling and simulation solution. The software will serve as the foundation for developing a comprehensive strategy for managing the utility’s drinking water distribution system and optimizing its performance. The selection was largely due to the performance and functionality of InfoWorks WS, its impressive track record in the UK industry, and the technical expertise the company is able to provide.

Winner of numerous prestigious honors including the Utility of the Year award for three years running, Yorkshire Water Services (YWS) is one of the ten largest water and sewerage companies in the world. It serves approximately 4.9 million people and 130,000 businesses in Yorkshire, part of North Lincolnshire, part of Derbyshire, in England. It operates and maintains more than 700 water and sewage treatment works, 120 reservoirs, and 40,000 miles of water and sewerage mains, supplying more than 1.25 billion liters of drinking water and collecting and treating about one billion liters of wastewater per day. 

“After an in-depth study of appropriate software, we chose the InfoWorks WS because of its functionality, ability to deal with large complex systems and integration with other MWH Soft products, particularly InfoNet,” said Peter Myerscough, Modeling Manager (Networks) for Yorkshire Water Services Ltd. “The commitment of the technical and support team to their customers is well known and adds value to the product. I am confident that modeling our distribution system using InfoWorks WS will help YWS develop optimized solutions whilst achieving maximum efficiencies, and thus deliver a first class service to our customers.”

Around the world, high quality all-mains InfoWorks WS models enable utilities to make informed planning, design and management decisions with confidence by giving them an accurate view of their drinking water distribution systems’ performance. This information — including water quality, supply, demand and infrastructure problems and investigations of remedial measures — allows them to provide a sustainable supply of high quality water at an acceptable pressure and flow rate to commercial, industrial and domestic users while minimizing loss through leakage. As part of the MWH Soft advanced workgroup modeling management platform, InfoWorks WS is built to handle very large and complex models and allow robust multi-user collaboration.

“Yorkshire Water is one of the world’s most progressive water utilities with an unshakable commitment to engineering excellence,” said Andrew Brown, EMEA Regional Manager for MWH Soft. “We’re proud that a leading water utility with such an advanced network modeling organization has extended its partnership with MWH Soft and adopted our comprehensive, high-performing InfoWorks WS software to round out its enterprise modeling program. We look forward to participating in Yorkshire Water’s continued success as it moves into a new decade of engineering excellence and environmental stewardship.”


Read more…

Subject: What are the Units for the five St. Venant Flow Terms in SWMM 5 and InfoSWMM?


This is how the flow is calculated in a link in SWMM5.  It uses the

 ·         Upstream and downstream head,

·         The user input length,

·         The weighted cross sectional area and hydraulic radius as I explained in the previous email,

·         The Center velocity,

·         The Center Cross sectional area, and

·         The Upstream and Downstream Cross sectional area.


The slope as listed in the output file is more for reference and is actually not used in the St. Venant Solution.   The way the program usually works is that the friction slope lags the water surface head slope with the difference made up by the change in flow.  The two non linear terms are usually small and only affect the flow during reverse or backwater events.


The new flow (Q) calculated at during each iteration of time step as


(1)Q for the new iteration = (Q at the Old Time Step – DQ2 + DQ3 + DQ4 ) / ( 1.0 + DQ1 + DQ5)

In which DQ2, DQ3 and DQ4 all have units of flow (note internally SWMM 5 has units of CFS and the flows are converted to the user units in the output file, graphs and tables of SWMM 5).


The equations and units for DQ2, DQ3 and DQ4 are:


(2)Units of DQ2 = DT * GRAVITY * aWtd * ( H2 – H1) / Length = second * feet/second^2 * feet^2 * feet / feet = feet^3/second = CFS


(3)Units of DQ3 = 2 * Velocity * ( aMid – aOld) * Sigma = feet/second * feet^2 = feet^3/second = CFS


(4)Units of DQ4 = DT * Velocity * Velocity * ( aDownstream – aUpstream) * Sigma / Length = second * feet/second * feet/second * feet^2 / feet = feet^3/second = CFS


The equations and units for DQ1 and DQ5 are:


(5)Units of DQ1 = DT * GRAVITY * (n/PHI)^2 * Velocity / Hydraulic Radius^1.333 = second * feet/second^2 * second^2 * feet^1/3 * feet/second / feet^1.33 = Dimensionless


(6)Units of DQ5 = K * Q / Area / 2 / Length * DT = feet^3/second * 1/feet^2 * 1/feet * second = Dimensionless


The five components calculated at the each time step and at each iteration during a time step and together predict the new Link Flow (Q) in SWMM 5. The value of the different components can be seen over time in Figure 1 and as a component percentage in Figure 2 and 3.

Figure 1: The Five St. Venant Components over time.


Figure 2: The relative magnitude of the St Venant terms over time for the same for the same link as in Figure 1.

Figure 3: The relative magnitude of the St Venant terms over time for the same for the same link as in Figure 1 shown in an area chart normalized to 100 percent. Normally the DQ1 and DQ2 terms balance each other except for backwater conditions or reverse flow in which the terms DQ3 and DQ4 can dominate.

Read more…

California MegaStorm

California's 'big one' might be a megastorm

http://www.latimes.com/news/local/la-me-mega-storm-20110123,0,3726475,print.story

Scientists say such a storm, occurring every 100 to 200 years, would inundate the Central Valley, trigger widespread landslides and cause flood damage to 1 in 4 homes.

By Tony Barboza, Los Angeles Times

8:51 PM PST, January 22, 2011


California's "big one" may not be an earthquake at all, but a devastating megastorm that would inundate the Central Valley, trigger widespread landslides and cause flood damage to 1 in 4 homes in the state.

The prospect of such a storm was raised this month by scientists predicting the consequences of an "atmospheric river" of moisture from the tropical Pacific hitting California with up to 10 feet of rain and hurricane-force winds over several weeks.

A team of more than 100 scientists, engineers and emergency planners used flood mapping, climate change projections and geologic flood history to simulate a hypothetical storm so intense that it occurs only every 100 to 200 years. They presented their findings in Sacramento during a conference sponsored by the U.S. Geological Survey, the Federal Emergency Management Agency and the California Emergency Management Agency.

The study isn't meant to be a forecast that such a fierce storm is imminent, but rather a push by scientists to publicize the risk of a catastrophe that they say is unfamiliar to most Californians.

In the scenario — powerful back-to-back storms — floods could require about 1 1/2 million people to evacuate and cause more than $300 billion in property damage. The economic loss would be four times that of a very large earthquake.

The simulation was based on the most severe storm event on record in California, a 45-day series of storms that started in December 1861 and, according to the Geological Survey, caused such extensive flooding that the Sacramento Valley was turned into "an inland sea, forcing the state Capitol to be moved temporarily from Sacramento to San Francisco, and requiring Gov. Leland Stanford to take a rowboat to his inauguration."

Geologists studying prehistoric flood deposits found evidence of even larger storms that occurred about every 300 years. Scientists project storms of that magnitude to become more frequent and powerful as a result of global warming.

Scientists said the study highlights the need to prepare for the large-scale devastation of powerful winter storms, which have received far less attention than the threat of earthquakes. Unlike a quake, which radiates from a single location, a megastorm would cause destruction spanning the entire state.

"We need to recognize that flooding here in California is as much of a risk as an earthquake," said Lucy Jones, chief scientist for the Geological Survey's Multi-Hazards Project. "These storms are like hurricanes in the amount of rain that they produce."

The exact effects of a colossal storm would depend on weather patterns that cannot be predicted until about a week before they strike. But the study identified some of the most vulnerable areas.

Los Angeles County, Orange County, San Diego and the San Francisco Bay Area would be especially susceptible to the floodwaters of overflowing rivers. A 300-mile-long expanse of the Central Valley would be underwater, with substantial losses of crops, livestock and urban structures. The rains would overwhelm much of the state's flood protection system, especially in the Sacramento-San Joaquin River Delta area, where levees aren't designed to withstand the flow predicted in such a storm.

Landslides would wash out key portions of roads, highways and railroads. Flooding would disrupt the ports of Los Angeles and Long Beach. Power, water and sewer lines could sustain damage that would take months to repair.

"It's an extreme but plausible storm" that would become more catastrophic the longer it lasted, said Mark Jackson, meteorologist-in-charge at the National Weather Service's Oxnard office, who wasn't involved in the research but went to the conference. "Our landscape can really handle quite a bit of rain. But when you get two storms back to back, you reach saturation, and the flood control systems are pushed over capacity."

The study, which took two years to complete, was designed as a follow-up to a 2008 report by the Geological Survey in which researchers examined the potential effects of a 7.8-magnitude earthquake on the San Andreas fault in Southern California.

As a next step, meteorologists are working to develop a scale that would rank the intensity of California's extreme storms with categories like the ones used to classify hurricanes.

tony.barboza@latimes.com

Read more…
Subject: Cutoff Divider in the SWMM 5 Kinematic Wave Solution

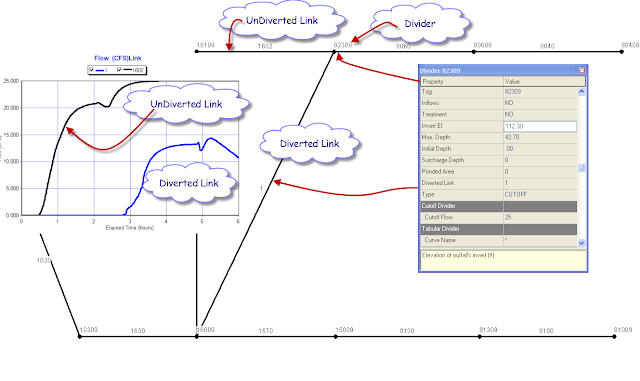
A divider node in the SWMM 5 Kinematic Wave solution will divide the inflow to a node for two downstream links based on three criteria:

1. Cutoff Divider,
2. Tabular Divider, and
3. Weir Divider

The rule for a Cutoff Divider is that the flow up to the Cutoff Flow will flow down the undiverted link and any flow over the cutoff flow will go down the diverted link. If the total inflow to a node exceeds the current flow in the undiverted link then the extra flow will go down the diverted link even though the flow in the undiverted link is not equal to the cutoff flow.

Figure 1.  How the Cutoff Divider Works in SWMM 5
Read more…

SWMM 5 Slope Rules

Note: SWMM 5 Slope Rules

The relationship between the upstream and downstream node invert and offset elevations, the input conduit length and the slope used in the SWMM 5 simulation are shown in Figure 1.
Figure 1.  Slope, length and elevation drop relationship relationships in SWMM 5.
Read more…

Adverse sloped links in SWMM 5 or InfoSWMM

Subject:  Adverse sloped links in SWMM 5 or InfoSWMM
This is how an adverse sloped link is treated in SWMM 5 or InfoSWMM – the link is reversed so that the link now has a positive slope and the original upstream node is now the downstream node. The flow in the reversed link is now negative as it moves from the original Node A to Node B and the flow is positive if the flow moves from the original node B to Node A.


Figure 1.  How Adverse Sloped Links are Treated in SWMM 5.

Read more…

Technical Program Released for 2011 Asia Pacific Water and Sewer Systems Modeling Conference


Leading Experts to Address Key Industry Event in Gold Coast, Australia, March 30-31
Technical Program and Registration at www.asiapacificwater.com


Broomfield, Colorado USA, January 18, 2010 — MWH Soft, a leading global innovator of wet infrastructure modeling and simulation software and technologies, today announced the release of the technical program for the fourth annual Asia Pacific Water and Sewer Systems Modeling Conference.  Widely considered to be the most comprehensive and significant infrastructure modeling, design and management technology conference of its kind, the event will be held March 30-31, 2011, at the Hotel Grand Chancellor Surfers Paradise Resort, on Australia’s Gold Coast.

The Asia Pacific Water and Sewer Systems Modeling Conference, organized by MWH Soft, is widely considered to be the most comprehensive and significant infrastructure modeling, design and management technology event of its kind. This once-a-year learning opportunity for the Asia Pacific modeling community brings together a wide array of water and wastewater technical experts and their managers who want to sharpen their skills, expand their knowledge, and share best practices with their peers. The theme of this year’s conference is “Using advanced modeling technology to enhance planning, operation and asset management.” During the two days of content-rich gatherings, participants will learn how to gain a competitive edge in this difficult economy by designing, operating and managing better and more cost-effective systems, protecting the environment, and safeguarding public health. 

The conference will feature unique technical presentations showcasing projects from throughout the region as well as keynote addresses from industry leaders, including Dr. Paul F. Boulos, President and COO, MWH Soft, USA; Dato’ Ir Ahmad Husaini Sulaiman, Director General, Department of Irrigation and Drainage, MALAYSIA; and Dr. Shahram Khosrowpanah, Professor of Water Resources Engineering, University of Guam, Water & Environmental Research Institute of the Western Pacific (WERI), GUAM.

Other highlights include a look at twenty-three state-of-the-art, real-world situations, personally presented by experts from utilities and engineering consulting firms. Participants will learn about increasing water network levels of service; the protection of investments through improved asset management; advanced sewer modeling; integrated catchment modeling; sophisticated river and flood modeling; operational modeling and transient analysis of water networks; opportunities and challenges facing water utilities; and using hydraulic models to understand sewer networks.

An interactive forum will provide useful industry insights and an opportunity to share cutting-edge information, proven strategies, cost-effective solutions and best practices with water and wastewater industry movers and shakers. The forum will also allow water and wastewater professionals to explore new ways of using engineering GIS technology and advanced hydraulic modeling, asset management and information management applications. Attendees will learn how they can leverage these tools to do their jobs better, easier, faster and more efficiently, maximizing their return on software investments and helping their organizations become more globally competitive. Participants will also earn valuable Continued Professional Development (CPD) hours.

The agenda also includes business implementation and management issues, technology updates, industry solutions presentations, and social and networking events. “This unique and inspirational event gives our users a fantastic opportunity to learn about the latest developments in water and wastewater infrastructure engineering and management,” said Boulos. “Attendees can carry this valuable learning experience back to their organizations, opening new avenues for increasing productivity and performance, enhancing project quality, maximizing return on their software investments, gaining a competitive edge on the future, advancing their careers, and improving the quality of life in their communities.”

This year’s conference is sponsored by Global Water Partnership Southeast Asia, SEAWUN, Singapore International Water Week, PWWA, Taipei Water Department, IWM, Queensland Urban Utilities, Melbourne Water, WaterCare, Wide Bay Water, Southern Water, Tweed Shire Council, Tauranga City, Byron Shire Council and Marlborough District Council.


Read more…

Subject:  Weather Underground Temperature Data and SWMM 5


Weather Underground is a site that provides excellent local weather information in the form of graphs, tables and csv files. You can use the data very easily in SWMM 5 by copying from Excel to a time series in SWMM 5 and then use either the wind speed, precipitation or temperature in a model. 


Figure 1. Weather Underground Temperature Data

Figure 2.  Save the Data to Excel by using the Comma Delimited File Command.


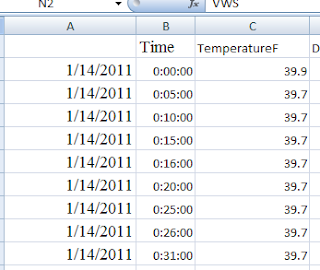
Figure 3. CSV File Exported to Excel

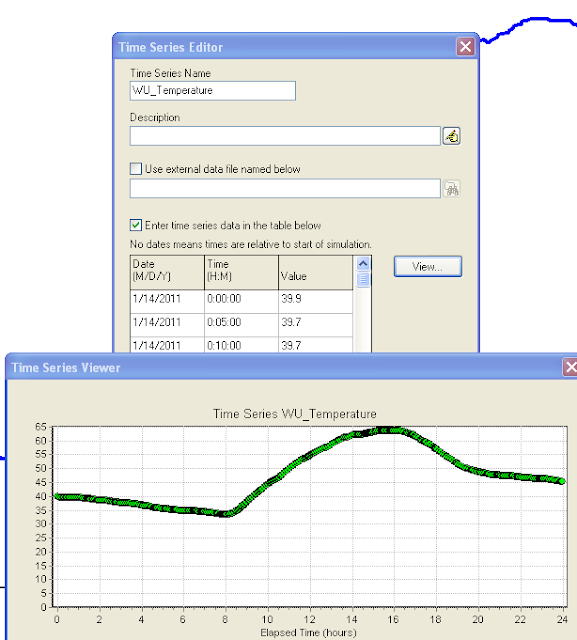
Figure 4:  Make a SWMM 5 Time Series to Copy and Paste the Temperature from the CSV File.


The data imported from the csv file to Excel and after the text to columns tool is used looks like this in Excel. The data is now ready to be imported into SWMM 5 as is by copying and pasting from Excel to a SWMM 5 time series file.  You need to perform the following steps:


1.     Make a new SWMM 5 Time Series,

2.     Copy and Paste the Temperature data from Excel to the SWMM 5 Time Series,

3.     Use the Climatelogy Data Tab and select the new Temperature Time Series as the source of the simulation temperature,

4.     You can see the simulated temperature by graphing the System Temperature.


Figure 5. SWMM 5 Climatology Tab and the resultant System Variable Graph of the Temperature.

Read more…